Fig. 13
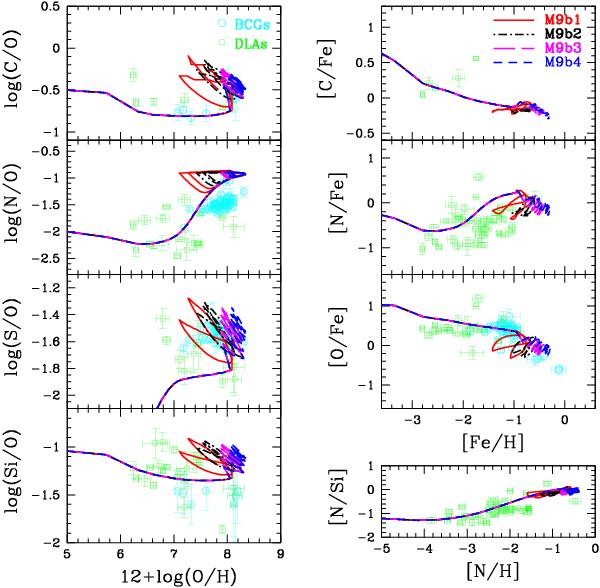
The evolutionary track of abundance ratios of C/O, N/O, S/O, Si/O, C/Fe, N/Fe, O/Fe, and N/Si as predicted by our best models (Minf = 109 M⊙) with a metal-enhanced wind (wH,He = 0.3). The solid red, dash-dotted black, long-dashed magentaand short-dashed blue lines are the results for M9b1, M9b2, M9b3 and M9b4 in Table 3. The observational data are same as in Fig. 3, open cyan circles for BCDs and open green squares for DLAs.
Current usage metrics show cumulative count of Article Views (full-text article views including HTML views, PDF and ePub downloads, according to the available data) and Abstracts Views on Vision4Press platform.
Data correspond to usage on the plateform after 2015. The current usage metrics is available 48-96 hours after online publication and is updated daily on week days.
Initial download of the metrics may take a while.