| Issue |
A&A
Volume 531, July 2011
|
|
|---|---|---|
| Article Number | A85 | |
| Number of page(s) | 8 | |
| Section | Extragalactic astronomy | |
| DOI | https://doi.org/10.1051/0004-6361/200811333 | |
| Published online | 17 June 2011 | |
A very extended molecular web around NGC 1275
1
LERMA, Observatoire de Paris, UMR 8112 du CNRS, 75014 Paris, France
e-mail: This email address is being protected from spambots. You need JavaScript enabled to view it.
2
Institut de Radio Astronomie Millimétrique, Domaine Universitaire, 38406 St. Martin d’Hères, France
3
Institute of Computational Cosmology, Durham University, South Road, Durham, DH1 3LE, UK
4
IoA, Madingley Road, Cambridge, CB3 OHA, UK
5
Laboratoire d’Astrophysique, École Polytechnique Fédérale de Lausanne (EPFL), Observatoire, 1290 Sauverny, Switzerland
Received: 12 November 2008
Accepted: 16 May 2011
Abstract
We present the first detection of CO emission lines in the Hα filaments at distances as far as 50 kpc from the centre of the galaxy NGC 1275. This gas is probably dense (≥103 cm-3). However, it is not possible to accurately determine the density and the kinetic temperature of this relatively warm gas (Tkin ~ 20–500 K) with the current data alone. The amount of molecular gas in the filaments is large – 109 M⊙ (assuming a Galactic N(H2)/ICO ratio). This is 10% of the total mass of molecular gas detected in this cD galaxy. This gas has large-scale velocities comparable to those seen in Hα. The origin of the filaments is still unclear, but their formation is very likely linked to the AGN positive feedback that regulates the cooling of the surrounding X-ray-emitting gas as suggested by numerical simulations. We also present high-resolution spectra of the galaxy core. The spatial characteristics of the double-peaked profile suggest that the molecular web of filaments and streamers penetrates down to radii of less than 2 kpc from the central AGN and eventually feeds the galaxy nucleus. The mass of gas inside the very central region is ~109 M⊙, and is similar to the mass of molecular gas found in the filaments.
Key words: cooling flows / galaxies: individual: NGC 1275 / galaxies: ISM / galaxies: kinematics and dynamics
© ESO, 2011
1. Introduction
The cD galaxy NGC 1275 lies at the centre of the Perseus cluster, the brightest galaxy cluster in the sky in X-rays. The galaxy is at a redshift of 0.01756 (DA = 72.6 Mpc; 1′′ is 350 pc). Past detections of CO in NGC 1275 were mainly toward the centre of the galaxy (Lazareff et al. 1989; Mirabel et al. 1989; Reuter et al. 1993; Braine et al. 1995; Inoue et al. 1996; Bridges & Irwin 1998; Lim et al. 2008). We also studied CO in filamentary structures all around the galaxy (inside r ≤ 10 kpc) and in three pointings at galactocentric distances as large as r ~ 25 kpc (Salomé et al. 2006, 2008a,b). The molecular gas coincides with the Hα filaments (e.g., Cowie et al. 1983; Conselice et al. 2001), within the hot gas seen in soft X-rays at 0.5 keV (Fabian et al. 2006). These results were in good agreement with the CO observations of the central 15 kpc made by Reuter et al. (1993) although the regions observed were not exactly the same. The central region was also observed with the VLA by Jaffe (1990) who detected extended 21 cm absorption in front of the radio source 3C 84. The HI is elongated in a east-west direction like the CO and the inferred neutral hydrogen mass found is ~5 × 10⁹ M⊙, that is, of the same order as the molecular gas mass (~1010 M⊙) found in the same region from CO observations (Salomé et al. 2006). Irwin & Bridges (2001) found a north-west/south-east extended continuum emission at 450 μm and 850 μm with SCUBA. This core-subtracted emission excess reveals a large amount of cold dust inside the central ~ 20 kpc (6 × 10⁷ M⊙ with Tdust ~ 20 K and β = 1.3).
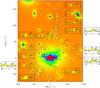 |
Fig. 1 CO spectra superposed on the Hα filament structure around NGC 1275 (Conselice et al. 2001). The double circles show the 1.3 and 3 mm beamwidths at the regions where CO was detected. CO(1–0) and CO(2–1) spectra are shown when detected. The channel width is 42 km s-1 and the y-axis is main beam brightness temperature, in mK. The velocity scale is from − 560 to 560 km s-1 in each insert. Small circles (1.3 mm beamwidth) show regions where no CO was detected. See Table 1 for more details. |
In this paper, we describe a new search with the IRAM 30 m telescope for molecular gas in the Hα filaments at the largest radii from the centre of NGC 1275 (outside the already observed central region and as far as 50 kpc). We clearly identify molecular filaments in five regions (see Fig. 1):
-
(1)
a 30 kpc-long filament, running north-south, not previously observed in CO (regions r1 through r4). The largest radius at which we detect CO (region r1) is 50 kpc (in projection) north of the centre of the galaxy;
-
(2)
the southeast Hα filaments (r10, r11, r15). The distance between the end of this filamentary system (region r11) and the end of the north filament (r1) is 200′′ (70 kpc);
-
(3)
a tangential filament to the north-east (r19, r20), where we have extended our previous CO observations;
-
(4)
the northwest area, including the well-known horseshoe filament, was observed in regions r5, r6, r8, r9, and r16;
-
(5)
the central region around 3C 84 was re-observed. Here, we made a high-sensitivity spectrum with high spectral resolution.
2. Observations
We used the IRAM 30 m telescope on Pico Veleta, near Granada, Spain. Observations were made in December 2007. Receivers were tuned to the CO(1–0) and CO(2–1) lines, redshifted to the adopted systemic velocity of NGC 1275 (113.280 and 226.559 GHz). We used two 512 × 1 MHz filters at 3 mm and two 250 × 4 MHz filters for the 1.3 mm receivers, thereby covering 1300 km s-1 at both wavelengths. We used wobbler switching, and checked the pointing on 3C 84, the radio source at the centre of NGC 1275. We observed in excellent weather with Tsys typically 250 K at 1.3 mm. To study the large extent of molecular gas around NGC 1275, we observed 18 regions inside the Hα filaments (Fig. 1). The beams of the 30 m telescope, at 3 mm and 1.3 mm, are 22′′ and 11′′ respectively (corresponding to 7.7 and 3.8 kpc at NGC 1275). The line intensities are given in main-beam brightness temperatures, Tmb. The ratio of Tmb to  at the 30 m is Tmb/
 /Beff = 1.27 at 3 mm and 1.75 at 1.3 mm (see http://www.iram.es/).
CO detections and tentative detections, or 3σ upper limits.
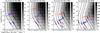 |
Fig. 2 Results of escape probability models from the RADEX program (Van der Tak et al. 2006) for four different kinetic temperatures, a range of H2 densities and a range of CO molecular column density per km s-1. The grey scale mapping and the black contour lines show the expected CO(2–1) emission TR(co21) [K] (see wedge to the right of each panel). Dashed blue lines show the CO(2–1)/CO(1–0) line temperature ratios 0.6, 0.9 and 1 as predicted by the RADEX program. Dash-dot red lines show the predicted CO(3–2)/CO(2–1) line temperature ratios 0.6, 0.9 and 1. The measured CO(2–1)/CO(1–0) line temperature ratio in r15 and r20 are close to one. So the possible solutions lie along the dashed-blue line of value one. We see that it is thus difficult to constrain the range of possible kinetic temperatures and H2 densities. Nervertheless, even with a high Tkin of 500 K, the density must be ≥ 102.5. Note also that if we consider a standard Milky Way Mgas/ |

The data were calibrated with the MIRA software and reduced with the CLASS package. We dropped spiky channels and bad scans, and subtracted linear baselines from each spectrum before averaging. Table 1 summarises the results.
3. Results, by region
3.1. The gas masses
For comparison with other work, the gas mass was estimated from a standard Milky Way conversion factor Mgas/ = 4.6 M⊙ (K km s-1 pc2)-1 (Solomon et al. 1997) for both transitions. Note however that the ICM metallicity is known to be less than solar Z < 0.6 Z⊙ in the Perseus cluster core (Schmidt et al. 2002). This low metallicity would lead to a larger N(H2)/CO conversion factor than the standard one used here (Leroy et al. 2009) and thus under-estimated gas masses. The CO luminosity is defined by = Tb
  with Tb ΩS the source brightness temperature times the source solid angle, ΔV the line width and
  the angular distance of the source. This gives = 23.5 Ωs ∗ b ICO
  (1 + z), with z the source redshift, Ωs ∗ b the solid angle of the source convolved with the telescope beam and
  the CO intensity (Tmb being the main beam temperature). This is for in K km s-1 pc2, Ωs∗b in arcsec2, DA in Mpc, and ICO in K km s-1. With this conversion factor, we find molecular gas masses of ~3–16 × 107 M⊙ in each pointed region of the filaments. We used the same conversion factor for both transitions since line ratios were close to one. We find more mass in the (larger) 3 mm beam than in the 1 mm beam. So the CO emission may be extended. Note however that this is just a hint because of the large uncertainties on the line width and main beam temperature measurements for both transitions.
3.2. The 30-kpc-long north filament, at very large radius
This filament extends over a radial distance from 20 to 50 kpc from the galaxy’s centre. We detected CO(2–1) at all positions observed, but no CO(1–0) apart from r4 (Table 1, regions r1 to r4). The fact that CO(2–1) is easier to detect means that the CO(1–0) is strongly affected by beam dilution, and therefore the emission is fragmented and clumpy on a scale of a few kpc (in region r4, where both lines are detected, the CO(2–1)/CO(1–1) main beam temperature ratio is ~2). The CO(2–1) line centre changes from −184 km s-1 (at r1), to −65 km s-1 (at r2), then jumps to +100 km s-1 (r3), and +50 km s-1 (r4). These line velocities show the same trend as in Hα (Hatch et al. 2006). Figure 4 (middle panel) shows the observed position-velocity diagram along this filament. There is a positive gradient from −200 km s-1 to +100 km s-1 as the radius decreases from 50 to 35 kpc, after which the velocity falls back to 40 km s-1 at a radius of 25 kpc. The good agreement with the Hα suggests that the CO traces most of the mass in the filaments, possibly surrounded by ionised gas radiating in Hα, at the interface with the hot intracluster medium. The shape of the gradient and the velocity reversal at the end could be due to the projection of the curved filament. Judging from the other loops that are oriented more face-on, it is obvious that many of the filaments have a significant curvature. The line width of regions r1 to r3 is 200 km s-1 while region r4 shows a narrower line width of 100 km s-1, more typical of the substructures in the eastern filament (see Salomé et al. 2008b). With the standard Milky Way conversion factor described above, we find a molecular gas mass of ~3–14 × 107 M⊙ in the northern filament.
3.3. The bright southeast filaments
Regions r10, r11 and r15 (the “blue-loop”) cover the southeast Hα filaments. Regions r10 and r11 are only detected in CO(2–1), while region r15 is also detected in CO(1–0). This filament has only negative velocities. There is a velocity change from −130 km s-1 to −250 km s-1 between regions r11 and r10 (compatible with the velocities of a falling filament). Region r11 has a broad CO(2–1) line width (370 km s-1), while in region r10, the CO(2–1) profile is narrow (120 km s-1). Slightly farther east is the region r15 at a velocity of −130 km s-1. These southeast Hα filaments are wider than the Northern ones, and the CO signal is probably less affected by beam dilution.
3.4. The north-east tangential filament
This filament is not radially extended like most of the other filaments around NGC 1275, but is instead perpendicular to a line through the centre of the galaxy. Region r19 is detected in CO(1–0) and region r20 in both CO(1–0) and CO(2–1). The line velocities are all negative, with no clear gradient. The line widths are narrower (70, 100 and 180 km s-1) than those of the other detections.
3.5. The horseshoe: the faintest region
The horseshoe was re-observed in different regions (r5, r6, r8, r9, r16) all along both sides of the U-shaped loop. We clearly detect the CO(2–1) line in the trunk of the filament, but this is the only firm detection. CO(2–1) is tentatively detected in region r8. The other regions were not detected in CO(1–0) or CO(2–1). Surprisingly, this region has weaker CO emission than the other filaments. If the inclination of the horseshoe filament along the line of sight is large, then the regions we observe could be at galactocentric distances as far as the faint regions detected in the Northern filament (50 kpc). In such a case, the small amount of molecular gas would not be visible with the rms noise we reached for those regions. The only exception is in region r8 where the integration time was longer (see Table 1).
3.6. Gas in the central 4 kpc
Figure 3 shows a double-peaked CO(2–1) line at the position of 3C 84 in 5 kms-1 channels in a 4-kpc diameter region. The negative velocities peak at −45 kms-1 and the positive ones at +65 kms-1. This feature can be interpreted as (i) inflowing gas, (ii) outflowing gas or (iii) a rotating pattern as observed in lines in the NIR by Wilman et al. (2005). It is not possible to disentangle from this three possibilities with the present observations alone. However, in previous observations (Salomé et al. 2006), the absence of a larger-scale rotation pattern was pointed out (inside a 8-kpc diameter region).
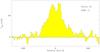 |
Fig. 3 CO(2–1) at the position of 3C 84. The axes are main-beam brightness temperature (in mK) vs. velocity, relative to 226.559 GHz (z = 0.01756). The channel width is 5 kms-1. |
The double-peaked line cannot therefore be unambiguously interpreted as evidence for a central rotating disk. Instead, the large accumulation of molecular gas (nearly 109 M⊙) in the central 4-kpc diameter of the galaxy could be the result of the recycling of cold gas inflow from the filaments back into the central potential well over several Gyr.
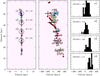 |
Fig. 4 Northern filament: comparison of the model with the observations. Left: contours are the surface density of molecular gas, predicted from the model. CO(2–1) beamwidths and positions are shown by black circles. Gas masses in each beam, predicted from the model, are in units of 108 M⊙. Middle: position-velocity diagram. Pink and blue isophotes in the colour map are the model predictions. Black crosses are CO(2–1) observations. Horizontal bars are the FWHM line widths. Red diamonds are Hα data (Hatch et al. 2006). Right: velocity distribution of the gas extracted from each region of the model. The predicted FWHM line widths of the distributions are in km s-1. |
4. Discussion
4.1. Large velocity dispersions
Observations by Salomé et al. (2008a) showed CO line widths of 10 to 30 kms-1 in the eastern filament when observed with a 3′′ beam. In our 22′′ beam, however, the CO(1–0) line width in that same filament is close to 100 kms-1. In the current data from the 30 m telescope, most of the CO(1–0) and (2–1) lines have widths of order 200 kms-1 in beams of 4 to 8 kpc. In the northern filament, the velocity dispersion is even larger. These large line widths are difficult to explain by motions within a single filament. It is more likely that in our beam, we observe an ensemble of very thin sub-filaments (as observed in the optical with the HST by Fabian et al. 2008) that consist of clumps of molecular clouds. Furthermore, these individual sub-filaments are very likely to have different projection angles, which would also increase the observed line widths, when observed with a larger beam. Nevertheless, region r11 has a particularly broad line width (373 km s-1). More observations with a larger bandwith coverage, as provided now by EMIR (Eight Mixer receiver)1 on the IRAM 30 m-telescope, would be useful to constrain with more confidence the effect of baseline fluctuation to which the results are very sensitive in the low signal/noise regime.
4.2. Comparison with numerical models
In Fig. 4, we compare the properties of the CO in the northern filament with the prediction of models in which the molecular gas forms out of uplifted ambient gas trapped by a plasma bubble. We have modelled the AGN feedback by instantaneously generating bubbles of gas in the ICM as already done by several authors (see Brüggen & Kaiser 2001, for instance). We have used very-high resolution TreeSPH simulations combined with a multiphase model and a model of plasma bubbles. We have also taken into account the presence of cooler and denser around the radio bubbles, assuming that it is the result of ambient gas pushed out by the inflating bubble. In our simulations, a fraction of the 1−2 keV gas present at the centre of clusters is trapped and entrained by the rising buoyant bubble to higher radius where the AGN heating is less efficient. The radiative cooling then makes it cool, thereby forming cold filamentary structures in the wake and in the rim of the bubbles (see Revaz et al. 2008, for a detailed description of the model). We tried to fit the data presented here by the model number 2 of Revaz et al. (2008). This is at t = 260 Myr and for a filament that is inclined by 60° with respect to the line of sight (the top of the filament pointing towards the observer). The model reproduces not only the filament elongation, but also the mass of molecular gas detected. At radii ≤40 kpc, the mean velocities and the velocity dispersions are also in good agreement, but at larger radius, the model fails to reproduce the negative velocities and most of the time it underestimates the velocity dispersions by a factor of 1.5, 2 and 1.3 for regions r1, r2, and r3 respectively. The negative velocities can be understood if the gas is still being uplifted by the rising bubble. In the simulation however, at temperature below 106 K, the cooling gas decouples from the ambient gas and falls towards the centre. This discrepancy would be removed if another physical process, like viscosity or magnetic fields (Fabian et al. 2008) increase the coupling between the different gas phases.
4.3. Line ratios
Among the 12 regions detected here, only three have been detected in CO(1–0) and CO(2–1). All the others are detected in CO(2–1) but not in CO(1–0). One region is detected in CO(1–0) and not in CO(2–1). As already mentioned, this could be explained by effects of beam dilution that makes the CO(1–0) emission from a clumpy molecular gas more difficult to detect than the CO(2–1) emission in general. Nevertheless, when closer to the centre, the filaments are widespread and overlap both the 3 mm and 1 mm beams. However, the emission seen in each wavelength may not come from the same part of the filaments. Evidence for that is the different line shapes seen in region r4, indicating CO(1–0) and CO(2–1) emission from dynamically and spatially different regions. This also explains the clear CO(1–0) detection alone in region r19: the region that dominates the emission lies in the CO(1–0) beam but not in the CO(2–1) one. In conclusion, the CO(2–1) to (1–0) line ratios are very uncertain, as are the parameters derived from these values.
The three regions with best signal-to-noise ratios (r4, r15, and r20) were detected in both CO(1–0) and (2–1). Averaged over these three regions, the ICO and Tmb (2–1/1–0) ratios are both equal to 1.5 ± 0.3. Because interferometer maps (Salomé et al. 2008b; Lim et al. 2008) show the CO is extended in the direction of the filaments, the different beam areas at CO(1–0) and (2–1) mean that the apparent line ratios should be corrected downward by a factor of 2, so that the corrected ICO and Tmb ratios are close to 0.8, that is, of the order of unity.
Simulations with the line escape probability program RADEX (van der Tak et al. 2007), indicate that these observed CO(2–1)/CO(1–0) line ratios of order unity can be obtained for gas kinetic temperatures ranging from 20 to 500 K, for H2 gas densities > 102.5−3 cm-3 and NCO/ΔV > 1015 cm-2 km s-1 (right panel of Fig. 2). So this gives very poor constraints on the gas properties.
With the JCMT, Bridges & Irwin (1998) observed CO(3–2) emission from the central 21-arcsec region of NGC 1275 and marginally detected the 13CO(2–1) inside a 22′′ beam. They made a two-component LVG model to reproduce the 12CO(3–2)/12CO(2–1) = 1.25 ± 0.25 and 12CO(2–1)/12CO(1–0) = 0.74 ± 0.11 line ratios. Their best model is for a cold component (10 K) at a density of 103 cm-3 and a hot (170 K) component at a density of 3.1 × 104 cm-3. Furthermore, new interferometer observations at CO(3–2) (Salomé et al., in prep.) indicate that the CO(3–2)/CO(2–1) ratio in some central filaments is also of order unity. This indicates that the CO is certainly optically thick in the central region and that the low-J CO line brightness and excitation temperatures are all close to the gas kinetic temperature.
It is not possible to definitively rule out an optically thin gas in the outer filament without CO(3–2) observations there. However, given that the observed (beam diluted) CO(2–1) brightness temperatures are about 7 mK, the area filling factor f2D in the CO(2–1) beam must be < 10-3. As a check on this reasoning, for the three filament regions (r4, r15 and r20), the H2 gas masses (Col. 8 of Table 1) estimated from the observed CO line intensities with a standard Milky Way conversion factor, are about 108 M⊙, within the beam. The beam diameter at CO(2–1) corresponds to 4 kpc, or 1.3 × 1022 cm, so the equivalent smoothed-out H2 density within a 4-kpc diameter sphere containing 108 M⊙ of H2 gas would be 0.03 cm-3, far too low a gas density to collisionally excite the CO (the CO(1–0) and CO(2–1) critical densities being 3 × 103 cm-3 and 104 cm-3 respectively, for a temperature of 100 K).
Therefore, to reach the gas density of >103 cm-3 needed to make the low-J CO lines optically thick, and to give line ratios close to unity, the volume filling factor f3D must be <3 × 10⁻⁵. The corresponding area filling factor within the beam must be <10-3, and the linear filling factor  , perpendicular to the filaments (or along the line of sight), must be <0.03, relative to the 4-kpc beam size.
These upper limits on the filling factors, derived from the CO conversion factor and the gas density required for excitation, are thus perfectly consistent with the filling factor upper limits derived above, from the observed line temperatures and those predicted by the escape probability programs, for the observed low-J line ratios. The linear filling factor of <0.03 implies a CO filament width (or CO clump size) of <120/ pc, N being the number of clouds inside the beam, which is also consistent with our size upper limit of <450 pc estimated directly from our interferometric maps (Salomé et al. 2008b).
There is therefore a coherent picture in which to interpret the observed low-J CO line ratios. The key is the low filling factor, which explains the observed main-beam brightness temperatures, the high gas density needed for collisional excitation in the escape probability predictions, the fact that the low-J line ratios are of order unity, the fact that the low-J lines are optically thick, and the interferometer upper limits on the CO clump sizes.
4.4. Molecular filament formation
The origin of the huge molecular filaments is unknown. We discuss here two possibilities. Scenario (1): the molecular gas forms in situ, far from the galaxy’s centre, from uplifted warm gas that cooled down behind rising bubbles, and eventually falls back (Revaz et al. 2008). This scenario must explain how to make the H2, which is difficult to form without dust (Ferland et al. 2009). Certainly, the bubble morphology of the filaments and X-ray cavities show that this gas must be mixed from the centre of the galaxy up to 100 kpc outward, and some dust from the galaxy must have enriched the whole region. The presence of dust could augment H2 formation rates even in the presence of X-rays. But the sputtering due to hot ions in the X-ray emitting gas can destroys unshielded dust in ≤1 Myr (Dwek & Arendt 1992), so if there is dust in the filaments, it must have come from the galaxy’s inner regions, rather from the intracluster medium. Scenario (2): the molecular gas comes from the inner part of the galaxy, entrained and dragged out by rising bubbles. The problem in this scenario is to explain how very small and dense clouds can be uplifted inside warmer gas. This is difficult to achieve, even in a highly viscous outflow and there is no such example in any observed galaxy yet. More modelling is needed to define the limits of these different scenarios. Stronger limits on the amount of dust in the filaments would help constrain the first scenario, and modelling the momentum transfer to clumps in a viscous flow (with and without magnetic viscosity) would help constrain the second scenario.
4.5. Star formation
There is no evidence of strong star formation in NGC 1275 filaments. Canning et al. (2010) have identified, with the Hubble Space Telescope, only two stellar regions in the south and south-east filaments (22 kpc from the nucleus). The predominantly young stellar population is concentrated in the Hα filaments. The authors derived a lower limit of 9 × 10⁸ M⊙ stars in blue clusters and a maximum lifetime of ~0.75 × 10⁸ yr, which gives a very large SFR of ~20 M⊙/yr. We have compared the amount of molecular gas with the star formation activity in these filaments The region of interest is indicated as r15 (“Blue-loop” filament) in the present paper and fills the CO(1–0) beam size. We have found a molecular gas mass of ~2 × 10⁸ M⊙. So if the SFR is as large as ~20 M⊙/yr then, the amount of gas is about 20% of the amount of recently formed stars. This means that most of the gas must have already been transformed into stars during the filament dynamical time (that roughly corresponds to the age of the stars). So if the star formation is still taking place in r15, the star formation efficiency inside this filament is very high. Indeed, even if the amount of molecular gas has been underestimated because of the sub-solar metallicity in the filaments Z < 0.6 Z⊙, (Schmidt et al. 2002), the filaments will still appear to be locally the place of an enhanced star formation activity with a star formation efficiency closer to ULIRGs than to normal spiral galaxies. The gas uplifted by the AGN bubble expansion in the ICM is pushed and compressed. In these overdense regions, the cooling is more efficient and molecular gas forms. This reservoir could then be converted very efficiently into stars in places where large scale dynamical effects can enhance the star formation (like in spiral arms of normal galaxies). The interface between the AGN cavities and the intracluster medium seems to be the place of such processes.
5. Conclusions
We have detected CO in a very extended filamentary network around NGC 1275. Up to about 109 M⊙ of molecular gas is detected inside thin and elongated filaments at distances between 7.8 kpc and 50 kpc from the galaxy centre. It is possible that the massive filaments seen in CO are an effect of the AGN feedback. The large scale motions in the Northern filament are difficult to explain with free-fall models. An accurate study of the dynamics of the filament should take into account the viscosity of the warmer gas (some part of it being uplifted). This will help lower the model predictions of the cold gas velocities. These single dish observations do not resolve the very thin filaments as observed with the HST (Fabian et al. 2008), so we certainly also mixed several filaments and averaged their individual velocities. The CO observed line widths are large. This confirms that the emission very likely comes from substructures unresolved by the 30 m telescope, possibly molecular cloud complexes within the filaments. Finally we reported a velocity structure in the emitting gas within 2 kpc of the AGN that could be a rotation disk. Whether this is the fate of the molecular gas found in very distant regions (20–50 kpc) is still an open question.
Acknowledgments
IRAM is supported by INSU/CNRS (France), MPG (Germany) and IGN (Spain). We thank the IRAM 30 m-telescope operators for their expert help with the observing.
References
- Braine, J., & Dupraz, C. 1994, A&A, 283, 407 [NASA ADS] [Google Scholar]
- Bridges, T. J., & Irwin, J. A. 1998, MNRAS, 300, 967 [NASA ADS] [CrossRef] [Google Scholar]
- Brüggen, M., & Kaiser, C. R. 2001, MNRAS, 325, 676 [NASA ADS] [CrossRef] [Google Scholar]
- Canning, R. E. A., Fabian, A. C., Johnstone, R. M., et al. 2010, MNRAS, 405, 115 [NASA ADS] [Google Scholar]
- Conselice, C. J., Gallagher, J. S., & Wise, R. F. G. 2001, AJ, 122, 2281 [NASA ADS] [CrossRef] [Google Scholar]
- Cowie, L. L., Hu, E. M., Jenkins, E. B., & York, D. G. 1983, ApJ, 272, 29 [NASA ADS] [CrossRef] [Google Scholar]
- Dwek, E., & Arendt, R. G. 1992, ARA&A, 30, 11 [NASA ADS] [CrossRef] [Google Scholar]
- Fabian, A. C., Sanders, J. S., Taylor, G. B., et al. 2006, MNRAS, 366, 417 [Google Scholar]
- Fabian, A. C., Johnstone, R. M., Sanders, J. S., et al. 2008, Nature, 454, 968 [NASA ADS] [CrossRef] [PubMed] [Google Scholar]
- Ferland, G., Fabian, A. C., Hatch, N. A., et al. 2009, MNRAS, 392, 1475 [NASA ADS] [CrossRef] [Google Scholar]
- Gao, Yu, & Solomon, P. M. 2004, ApJ, 606, 271 [NASA ADS] [CrossRef] [Google Scholar]
- Gao, Yu, Carilli, C. L., Solomon, P. M., et al. 2005, MNRAS, 358, 765 [NASA ADS] [CrossRef] [Google Scholar]
- Hatch, N. A., Crawford, C. S., Johnstone, R. M., & Fabian, A. C. 2006, MNRAS, 367, 433 [NASA ADS] [CrossRef] [Google Scholar]
- Inoue, M. Y., Kameno, S., Kawabe, R., et al. 1996, AJ, 111 [Google Scholar]
- Irwin, J. A., & Bridges, T. J. 2001, MNRAS, 328, 359 [NASA ADS] [CrossRef] [Google Scholar]
- Jaffe, W. 1990, A&A, 240, 254 [NASA ADS] [Google Scholar]
- Kennicutt, R. C., Jr. 1998, ARA&A, 36, 189 [Google Scholar]
- Lazareff, B., Castets, A., Kim, D. W., & Jura, M. 1989, ApJ, 335, L13 [NASA ADS] [CrossRef] [Google Scholar]
- Leroy, A. K., Bolatto, A., Bot, C., et al. 2009, ApJ, 702, 352 [NASA ADS] [CrossRef] [Google Scholar]
- Lim, J., Ao, Y., & Trun, D.-V. 2008, ApJ, 672, 252 [NASA ADS] [CrossRef] [Google Scholar]
- Mirabel, I. F., Sanders, D. B., & Kazes, I. 1989, ApJ, 340, 9 [Google Scholar]
- Reuter, H. P., Pohl, M., Lesch, H., & Sievers, A. W. 1993, A&A, 277, 21 [NASA ADS] [Google Scholar]
- Revaz, Y., Combes, F., & Salomé, P. 2008, A&A, 477, 33 [Google Scholar]
- Salomé, P., Combes, F., Edge, A. C., et al. 2006, A&A, 454, 437 [NASA ADS] [CrossRef] [EDP Sciences] [Google Scholar]
- Salomé, P., Combes, F., Revaz, Y., et al. 2008a, A&A, 484, 317 [NASA ADS] [CrossRef] [EDP Sciences] [Google Scholar]
- Salomé, P., Revaz, Y., Combes, F., et al. 2008b, A&A, 483, 793 [NASA ADS] [CrossRef] [EDP Sciences] [Google Scholar]
- Schmidt, R. W., Fabian, A. C., & Sanders, J. S. 2002, MNRAS, 337, 71 [NASA ADS] [CrossRef] [Google Scholar]
- Solomon, P. M., Downes, D., Radford, S., & Barrett, J. W. 1997, ApJ, 478, 144 [NASA ADS] [CrossRef] [Google Scholar]
- Van der Tak, F. F. S., Black, J. H., Schier, F. L., Jansen, D. J., & van Dishoeck, E. F. 2007, A&A, 468, 627 [NASA ADS] [CrossRef] [EDP Sciences] [Google Scholar]
- Weiss, A., Downes, D., Neri, R., et al. 2007, A&A, 467, 995 [Google Scholar]
- Wilman, R. J., Edge, A. C., & Johnstone, R. M. 2005, MNRAS, 359, 755 [NASA ADS] [CrossRef] [Google Scholar]
All Tables
All Figures
|
Fig. 1 CO spectra superposed on the Hα filament structure around NGC 1275 (Conselice et al. 2001). The double circles show the 1.3 and 3 mm beamwidths at the regions where CO was detected. CO(1–0) and CO(2–1) spectra are shown when detected. The channel width is 42 km s-1 and the y-axis is main beam brightness temperature, in mK. The velocity scale is from − 560 to 560 km s-1 in each insert. Small circles (1.3 mm beamwidth) show regions where no CO was detected. See Table 1 for more details. |
| In the text | |
|
Fig. 2 Results of escape probability models from the RADEX program (Van der Tak et al. 2006) for four different kinetic temperatures, a range of H2 densities and a range of CO molecular column density per km s-1. The grey scale mapping and the black contour lines show the expected CO(2–1) emission TR(co21) [K] (see wedge to the right of each panel). Dashed blue lines show the CO(2–1)/CO(1–0) line temperature ratios 0.6, 0.9 and 1 as predicted by the RADEX program. Dash-dot red lines show the predicted CO(3–2)/CO(2–1) line temperature ratios 0.6, 0.9 and 1. The measured CO(2–1)/CO(1–0) line temperature ratio in r15 and r20 are close to one. So the possible solutions lie along the dashed-blue line of value one. We see that it is thus difficult to constrain the range of possible kinetic temperatures and H2 densities. Nervertheless, even with a high Tkin of 500 K, the density must be ≥ 102.5. Note also that if we consider a standard Milky Way Mgas/ |
| In the text | |
|
Fig. 3 CO(2–1) at the position of 3C 84. The axes are main-beam brightness temperature (in mK) vs. velocity, relative to 226.559 GHz (z = 0.01756). The channel width is 5 kms-1. |
| In the text | |
|
Fig. 4 Northern filament: comparison of the model with the observations. Left: contours are the surface density of molecular gas, predicted from the model. CO(2–1) beamwidths and positions are shown by black circles. Gas masses in each beam, predicted from the model, are in units of 108 M⊙. Middle: position-velocity diagram. Pink and blue isophotes in the colour map are the model predictions. Black crosses are CO(2–1) observations. Horizontal bars are the FWHM line widths. Red diamonds are Hα data (Hatch et al. 2006). Right: velocity distribution of the gas extracted from each region of the model. The predicted FWHM line widths of the distributions are in km s-1. |
| In the text | |
Current usage metrics show cumulative count of Article Views (full-text article views including HTML views, PDF and ePub downloads, according to the available data) and Abstracts Views on Vision4Press platform.
Data correspond to usage on the plateform after 2015. The current usage metrics is available 48-96 hours after online publication and is updated daily on week days.
Initial download of the metrics may take a while.