Fig. 2
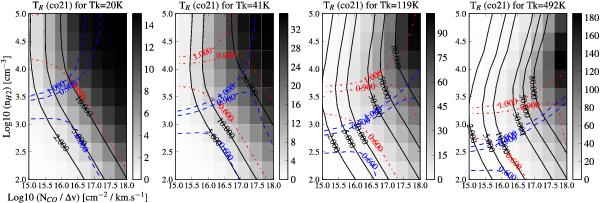
Results of escape probability models from the RADEX program (Van der Tak et al. 2006) for four different kinetic temperatures, a range of H2 densities and a range of CO molecular column density per km s-1. The grey scale mapping and the black contour lines show the expected CO(2–1) emission TR(co21) [K] (see wedge to the right of each panel). Dashed blue lines show the CO(2–1)/CO(1–0) line temperature ratios 0.6, 0.9 and 1 as predicted by the RADEX program. Dash-dot red lines show the predicted CO(3–2)/CO(2–1) line temperature ratios 0.6, 0.9 and 1. The measured CO(2–1)/CO(1–0) line temperature ratio in r15 and r20 are close to one. So the possible solutions lie along the dashed-blue line of value one. We see that it is thus difficult to constrain the range of possible kinetic temperatures and H2 densities. Nervertheless, even with a high Tkin of 500 K, the density must be ≥ 102.5. Note also that if we consider a standard Milky Way Mgas/ conversion factor, then we expect NCO/ΔV > 1 × 1017 cm-2 km s-1 if f2D ~ 10-3 i.e. TR ~ 10 K, which gives slightly higher densities (≥ 102.9). Finally, Bridges & Irwin (1998) reported a CO(3–2)/CO(2–1) line ratio close to one in the central ~8 kpc region. If this is also true for the filaments, then the possible solutions would lie at the intersection of the dashed blue line (values ~0.9–1) with the dash-dot red line (values ~0.9–1), which means even higher densities. The high-J CO lines are thus important diagnostics to determine the gas properties.
Current usage metrics show cumulative count of Article Views (full-text article views including HTML views, PDF and ePub downloads, according to the available data) and Abstracts Views on Vision4Press platform.
Data correspond to usage on the plateform after 2015. The current usage metrics is available 48-96 hours after online publication and is updated daily on week days.
Initial download of the metrics may take a while.