| Issue |
A&A
Volume 530, June 2011
|
|
|---|---|---|
| Article Number | L3 | |
| Number of page(s) | 5 | |
| Section | Letters | |
| DOI | https://doi.org/10.1051/0004-6361/201116921 | |
| Published online | 28 April 2011 | |
Letters to the Editor
Observation of H2O in a strongly lensed Herschel-ATLAS source at z = 2.3⋆
1
UPMC Univ Paris 06, UMR7095, Institut d’Astrophysique de Paris, 75014 Paris, France
e-mail: This email address is being protected from spambots. You need JavaScript enabled to view it.
2
CNRS, UMR7095, Institut d’Astrophysique de Paris, 75014 Paris, France
3
Institut de Radioastronomie Millimétrique (IRAM), 300 rue de la Piscine, 38406 Saint-Martin-d’Hères, France
4 Department of Physics and Astronomy, University of Pennsylvania, Philadephia, PA 19104, USA
5
Leiden Observatory, Leiden University, Post Office Box 9513, 2300 RA Leiden, The Netherlands
6
Department of Physics and Astronomy, The Open University, Walton Hall, Milton Keynes, MK7 6AA, UK
7
Univ Paris-Sud and CNRS, Institut d’Astrophysique Spatiale, UMR8617, 91405 Orsay, France
8
Argelander Institut fur Astronomie, Universit Bonn, Auf dem Hügel 71, 53121 Bonn, Germany
9 Astrophysics Group, Physics Department, Blackett Lab, Imperial College London, Prince Consort Road, London SW7, UK
10
Department of Physics and Astronomy, University of California, Irvine, CA 92697, USA
11
Institute for Computational Cosmology, Durham University, South Road, Durham DH1 3LE, UK
12
Laboratoire Astrophysique, Instrumentation et Modélisation Paris Saclay, Commissariat à l’Énergie Atomique (CEA)/Direction des Sciences de la Matière (DSM) – CNRS – Université Paris Diderot, Institut de recherche sur les lois fondamentales de l’Univers (Irfu)/Service d’Astrophysique, CEA Saclay, Orme des Merisiers, 91191 Gif-sur-Yvette Cedex, France
13
INAF – Osservatorio Astronomico di Padova, Vicolo Osservatorio 5, 35122 Padova, Italy ;
SISSA, via Bonomea 265, 34136 Trieste, Italy
14
School of Physics and Astronomy, Cardiff University, The Parade, Cardiff, CF24 3AA, UK
15
Instituto Nacional de Astrofísica, Óptica y Electrónica, Apartado Postal 51 y 216, 72000 Puebla, Mexico
16
UK Astronomy Technology Center, Royal Observatory Edinburgh, Edinburgh, EH9 3HJ, UK
17
School of Physics and Astronomy, University of Nottingham, University Park, Nottingham NG7 2RD, UK
18
GEPI, Observatoire de Paris, CNRS, Université Paris Diderot, 5 Place Jules Janssen, 92190 Meudon, France
19
SETI Institute, 515 North Whisman Avenue, Mountain View CA, 94043, USA
20
Astrophysics Branch, NASAAmes Research Center, MS 245-6, Moffett Field, CA 94035, USA
21
Oxford Astrophysics, Denys Wilkinson Building, University of Oxford, Keble Road, Oxford, OX1 3RH, UK
22
Max-Plank-Institut fïr Radioastronomie, Auf dem Hïgel 69, 53121 Bonn, Germany
23
National Radio Astronomy Observatory Post Office Box 2, Green Bank, WV 24944, USA
24 INAF-IASF Milano, via E. Bassini 15, 20133, Italy
25
Institute for Astronomy, University of Edinburgh, Royal Observatory, Blackford Hill, Edinburgh EH9 3HJ, UK
26
University of Padova, Department of Astronomy, Vicolo Osservatorio 3, 35122 Padova, Italy
27
School of Astronomy, Institute for Research in Fundamental Sciences (IPM), PO Box 19395-5746, Tehran, Iran
28
California Institute of Technology, Pasadena, CA 91125, USA
29
Jet Propulsion Laboratory, Pasadena, CA 91109, USA
30
University of Colorado, CASA 389-UCB, Boulder, CO 80303, USA
31
Sterrenkundig Observatorium, Universiteit Gent, Krijgslaan 281-S9, 9000 Gent, Belgium
32
Departamento de Astrofísica, Facultad de CC. Físicas, Universidad Complutense de Madrid, 28040 Madrid, Spain
33
Department of Physics, McGill University, Ernest Rutherford Building, 3600 Rue University, Montréal, Québec, H3A 2T8, Canada
34
Department of Physics and Astronomy, Rutgers, The State University of New Jersey, Piscataway, NJ 08854-8019, USA
35 Centre for Astrophysics, Science & Technology Research Institute, University of Hertfordshire, Hatfield, Herts, AL10 9AB, UK
36
Department of Physics and Astronomy, The Open University, Milton Keynes, MK7 6AA, UK
Received: 18 March 2011
Accepted: 11 April 2011
Abstract
The Herschel survey, H-ATLAS, with its large areal coverage, has recently discovered a number of bright, strongly lensed high-z submillimeter galaxies. The strong magnification makes it possible to study molecular species other than CO, which are otherwise difficult to observe in high-z galaxies. Among the lensed galaxies already identified by H-ATLAS, the source J090302.9-014127B (SDP.17b) at z = 2.305 is remarkable because of its excitation conditions and a tentative detection of the H2O 202-111 emission line (Lupu et al. 2010, ApJ, submitted). We report observations of this line in SDP.17b using the IRAM interferometer equipped with its new 277–371 GHz receivers. The H2O line is detected at a redshift of z = 2.3049 ± 0.0006, with a flux of 7.8 ± 0.5 Jy km s-1 and a FWHM of 250 ± 60 km s-1. The new flux is 2.4 times weaker than the previous tentative detection, although both remain marginally consistent within 1.6σ. The intrinsic line luminosity and ratio of H2O(202 − 111)/CO(8 − 7) are comparable with those of the nearby starburst/enshrouded-AGN Mrk 231, and the ratio I(H2O)/LFIR is even higher, suggesting that SDP.17b could also host a luminous AGN. The detection of a strong H2O 202 − 111 line in SDP.17b implies an efficient excitation mechanism of the water levels that must occur in very dense and warm interstellar gas probably similar to Mrk 231.
Key words: galaxies: high-redshift / galaxies: starburst / galaxies: active / infrared: galaxies / submillimeter: galaxies / radio lines: galaxies
Herschel is an ESA space observatory with science instruments provided by European-led Principal Investigator consortia and with important participation from NASA.
© ESO, 2011
1. Introduction
Gravitationally lensed sources have played an important role in infrared and submillimeter studies of high-z galaxies since the discovery of IRAS FSC10214+4724 (hereafter IRAS F10214; Rowan-Robinson et al. 1991). The studies of this and two other bright strongly-lensed QSOs, APM 08279+5255 (Downes et al. 1999) and the Cloverleaf (H1413+117; Barvainis et al. 1994), demonstrate the utility of using high gravitational magnification to investigate the detailed properties of distant galaxies. These sources allowed pioneering detections of the infrared and submillimeter continuum and lines of CO, HCO+, HCN, HNC, CN, and H2O (see e.g., Solomon & Vanden Bout 2005; Guélin et al. 2007; Riechers et al. 2010, 2011a). These three lensed sources also provided the first few spatially resolved measurements on scales of hundreds of parsecs. Before Herschel these sources were without peer, except for SMMJ2135–0102, MM 18423+5938 and SXDF1100.001 (Swinbank et al. 2010; Lestrade et al. 2010; Ikarashi et al. 2010).
Now the wide area surveys from space – especially H-ATLAS and HerMES with Herschel, which will observe 570 deg2 and 70 deg2, respectively (Eales et al. 2010; Oliver et al. 2010) – and from the ground, for example, with the South Pole Telescope (Vieira et al. 2010), are increasing the area of submillimeter surveys by factors of hundreds over previous surveys. Correspondingly, we expect that the number of strongly lensed submillimeter sources will also increase by a very large factor. From the analysis and intensive follow-up of the five strongest lenses found in the H-ATLAS science demonstration (SDP) field of 14.5 deg2 (Negrello et al. 2010, hereafter Ne10), the H-ATLAS team has shown that these lenses are relatively easy to identify. With S500 μm > 100 mJy and S1.2 mm > ~ 10 mJy, their number exceeds that of the unlensed high-z submillimeter sources (Negrello et al. 2007). The number of similar high-z strongly lensed galaxies in the full H-ATLAS survey will be larger than 100.
CO lines are almost the only molecular lines currently detected with the very broad band spectrometers such as Z-Spec (Lupu et al. 2010, hereafter Lu10; Scott et al. 2011) and Zpectrometer (Frayer et al. 2011) and with interferometers (Cox et al. 2011; Riechers et al. 2011b; Leeuw et al., in prep.). Apart from ~20 CO-line detections in high-zHerschel galaxies, the only other molecule detection reported in these sources is the tentative detection with Z-Spec of the emission line of para-H2O 202 − 111 (rest LST frequency 987.93 GHz) in the z = 2.305 source H-ATLAS J090302.9-014127B – hereafter SDP.17b (Lu10). However, the noise is high in this part of the Z-Spec spectrum and, in addition, the line is partially blended with another strong feature that was identified as CO(5–4) emission from the intervening massive lensing galaxy at z = 0.942 H-ATLAS J090302.9-014127A – hereafter SDP.17a – as discussed in Lu10 and Ne10. Here we report new measurements of the H2O 202 − 111 line in SDP.17b using the IRAM Plateau de Bure interferometer (PdBI), which confirm the line and enable a more detailed study of its properties.
We adopt a cosmology with H0 = 71 km s-1 Mpc-1, ΩM = 0.27, ΩΛ = 0.73 (Spergel et al. 2003).
Observed parameters of the H2O 202−111 emission line in SPD.17b
2. Water lines in high-z galaxies
Conducting studies of H2O in high-z galaxies is important. If is not locked in grains, H2O may be one of the most abundant molecules in the gas. It is known to be a tracer of the dense, warm gas and possibly of strong infrared radiation because its large dipole and high energy levels make its excitation difficult and sensitive to the interstellar conditions (González-Alfonso et al. 2010, hereafter G-A10).
Spectra from the Infrared Space Observatory (ISO) have shown that the far-infrared H2O lines are prominent in local ultra-luminous infrared galaxies (ULIRGs) and composite AGN/starburst galaxies, such as Mrk 231 and Arp 220, which show a series of H2O lines in absorption (González-Alfonso et al. 2008, 2004). The recent Herschel SPIRE FTS submillimeter spectrum of Mrk 231 provides a wealth of molecular emission lines including high-J CO lines up to J = 13, seven rotational lines of H2O almost comparable in strength to the CO emission lines, as well as other species (OH+, H2O+, and HF) which had not been observed before in external galaxies (van der Werf et al. 2010 (hereafter vdW10); G-A10); Fischer et al. 2010). A high intensity of the H2O lines implies a high H2O column density in a compact nuclear component, and thus a H2O abundance approaching 10-6 (G-A10). This is most probably the consequence of shocks, cosmic rays, dense hot cores, possibly a moderated XDR (X-ray dominated, see e.g. Meijerink & Spaans 2005) chemistry, and/or an “undepleted chemistry” where grain mantles have evaporated. Therefore a composite model might be necessary to explain the water emission – shocks excited by the mechanical energy of the starburst or perhaps an AGN may enhance the gas phase abundance of water, while a strong infrared radiation field from an intense starburst or AGN (similar to Mrk 231) may be responsible for the high excitation. As stressed by G-A10, the high H2O/CO ratio makes it unlikely that the H2O emission originates in classical photon-dominated regions (PDR), since in the Orion Bar, the proto-typical Galactic PDR, CO lines are a factor ≥ 50 stronger than the H2O lines. Similarly, in the starburst galaxy M82, this ratio is ≈ 40 (Weiß et al. 2010). Cosmic-ray-dominated chemistry (see e.g. Papadopoulos 2010) appears to be excluded because it is unable to heat the gas to sufficiently high temperatures. The favoured model for explaining these extraordinary features implies a high H2O abundance and the presence of a small star-forming disk, composed of clumps of dense gas exposed to strong ultraviolet radiation, dominating the emission of CO lines up to J = 8 (vdW10, G-A10). X-rays from the accreting supermassive black hole in Mrk 231 are likely to contribute significantly to the excitation and chemistry of the inner disk, as shown by the presence of OH+ and H2O+ lines.
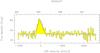 |
Fig. 1 Spectrum of the para H2O 202−111 emission line towards SDP.17b, where the velocity scale is centred on its observed frequency at 298.93 GHz (corresponding to z = 2.3049). The rms noise is ~4.7 mJy/beam in 31.6 MHz channels. A Gaussian fit to the H2O spectrum is shown as a solid line while the dotted line shows the underlying dust continuum emission. The H2O line is clearly asymmetric and not well fit by a Gaussian profile. |
The number density of galaxies similar to Mrk 231 is expected to be at least two orders of magnitude higher at high than at low redshift (Fabian et al. 2000; Alexander et al. 2005). They should represent a significant fraction of all submillimeter galaxies (SMGs), and thus of lensed SMGs detected by Herschel. At high-z, the far-infrared lines of molecular species such as H2O are redshifted into the atmospheric sub/millimeter windows. For strongly lensed sources, these molecular lines are within the detection reach of present sub/millimeter interferometers such as the Plateau de Bure Interferometer (PdBI) and future facilities such as ALMA and NOEMA. Tentative detections of H2O were reported in the Cloverleaf for the 220 − 111 transition (Bradford et al. 2009, Table 2) and IRAS F10214 for the 211−202 transition (Casoli et al. 1994). In addition, luminous water masers (νrest = 22.2 GHz) were detected in a lensed quasar at z = 2.64 (Impellizzeri et al. 2008) and tentatively in F10214 (McKean et al. 2011). The H2O 110–101 line was also detected in absorption at z = 0.685 towards B0218+357 by Combes & Wiklind (1997). It is likely that in the near future, the whole set of molecular lines (including the water lines) seen in Mrk 231 and other local sources (vdW10, Fischer et al. 2010) will be detectable with ALMA in high-z lensed galaxies, provided they are comparable to Mrk 231.
3. Observations and results
In order to confirm the detection towards SDP.17b of the redshifted H2O 202−111 emission line, we used the PdBI with six antennae and the new “Band 4” receiver, which covers the frequency range 277–371 GHz. Because the wide-band correlator, WideX, provides a contiguous frequency coverage of 3.6 GHz in dual polarization, it allowed us to include the frequency of 297 GHz at the edge of the bandpass where Lu10 reported a second strong, but partially blended line, which they identified as the CO(5–4) emission of the lensing galaxy SDP.17a at z = 0.942 ± 0.004.
First observations were made in the compact D-configuration on 2011 January 3 in conditions with good atmospheric phase stability (seeing of 0.7′′) and reasonable transparency (PWV ≤ 0.5 mm). They were complemented by observations in extended A- and B-configurations in February and March 2011. With a total of ~6.2 h on-source integration, a strong signal was detected both in the continuum and in the purported H2O line (Fig. 1). The dust continuum flux density at 1.0 mm is 32.3 ± 2 mJy, which agrees well with the value derived from Z-Spec by Lu10, and used in the SED fits of Ne10 and Lu10. However, the respective contributions of SDP.17b and SDP.17a to this value remain uncertain. The maximum flux density and integrated intensity of the H2O line are 29 mJy and 7.8 ± 0.5 Jy km s-1, respectively, with a FWHM of 250 ± 60 km s-1. The line central frequency of 298.93 GHz corresponds to z = 2.3049 ± 0.0006, which is consistent with the value reported by Lu10, 2.308 ± 0.011.
Compared to the value previously reported by Lu10 of 19 ± 7 Jy km s-1, the intensity is lower by a factor 2.4 and marginally consistent within 1.6 σ. The relatively low angular resolution ( ≈ 1′′) did not allow us to study the spatial properties of the signal. The source does not seem to be resolved and it is unlikely that significant flux is missed, either from the H2O line or the continuum flux, as shown by the consistency of the latter with the Z-Spec value.
Clearly, there is no other strong line in this spectral range with an intensity approaching that of H2O. In particular, this precludes the presence of a CO(5–4) line of SDP.17a stronger than about 3 Jy km s-1, i.e. 1/10 of the tentative detection reported by Lu10 (29 ± 9 Jy km s-1), in the redshift range 0.922 < z < 0.944. However, emission from SDP.17a in the CO(5–4) line is not ruled out and could be present at a redshift z > 0.944, outside of the bandpass of the current observations.
4. Discussion: high-excitation gas
4.1. Properties of SDP.17b
In order to assess the implication of the detection of H2O emission in SDP.17b, it is important to summarize the current information on the properties of SDP.17b and to consider this source in relation to other submillimeter lensed sources. SDP.17b is one of the five prominent high-z lensed SMGs found by Ne10 in the H-ATLAS SDP field, with an apparent infrared luminosity LIR = 4 × 10¹³ L⊙ (8–1000 μm, Lu10). The information on the lensing system remains limited because no high-resolution sub/millimeter image is available yet. However, Ne10 suggested that the deflector SDP.17a could consist of two foreground lensing masses at similar high redshifts (z ~ 0.8−0.9). The amplification factor of SDP.17b is still unknown and could reach values of ≈10 or more (Ne10). The infrared luminosity of SPD.17b is thus comparable to typical ULIRGs, including Mrk 231 (LIR = 4 × 10¹² L⊙). The mid-infrared photometry of SPD.17b is unknown, but, because it is detected at 100 μm (Ne10), there might be an AGN contribution.
Properties of the para H2O 220−111 emission line in active galaxies
The most remarkable property of SDP.17 is the richness of its 200–300 GHz Z-Spec spectrum (Lu10). Besides the H2O line, it displays three CO lines (J = 6–5, 7–6(+[CI]) and 8–7) at z = 2.3. Despite the relatively low individual S/N ratios (~1.5−3) of these line intensities, their distribution has no clear sign of a turnover up to J = 8–7, pointing to a similarity with both Mrk 231 and the Cloverleaf (Lu10). In fact, the CO spectral line energy distribution of Mrk 231 also has a peak between the CO(5–4) and CO(6–5) transitions, but it has in addition a strong high-excitation component as seen in vdW10. However, there is as yet no information about CO lines above J = 8–7 in SDP.17b. Note that SDP.17b is one of the rare examples among the strongly lensed galaxies detected by Herschel (together with HERMESJ 105751.1+573027 (HLSW-01), Scott et al. 2011) that display strong high-J CO lines. While the information about high-J CO lines is still lacking in many of them, several other well studied high-z lensed sources either from H-ATLAS (J091304.9-005344 (SDP.130), Lu10; J142413.9+022304 (SDP.15.141), Cox et al. 2011) or from elsewhere (Weiß et al. 2005; Danielson et al. 2011; Lestrade et al. 2010) have a clear turnover at lower J values.
Nothing is published yet about the results of observations of lower-J CO millimeter lines of SPD.17b. However, several studies are in progress at CARMA, the GBT (with Zpectrometer) and PdBI, including observations of the J = 1–0, 3–2 and 4–3 lines (Leeuw et al., in prep.; Frayer et al., in prep.; Cox et al., in prep.). These results will provide information on both the molecular gas of SPD.17b and the lensing system. It will be interesting to compare the profiles and the spatial distributions of the H2O and CO emission lines and to study the connection between the warm gas (emitting in H2O lines) and the colder gas (traced in CO), in particular the cold gas traced by the CO(1–0) line.
The FIRST radio survey (Becker et al. 1995) yields S1.4 GHz = 464 ± 145 μJy for SDP.17. From the LIR value and using the definition of Sajina et al. (2008), we find for the IR/radio parameter q = 2.53. This value is well within the range of q values for z ~ 2 starburst sources (e.g. Sajina et al. 2008; Fiolet et al. 2009; Ivison et al. 2010). This suggests that SDP.17b is not a radio-loud source and that star formation is responsible for most of its far-infrared luminosity (similar conclusions could apply to SDP.17a). However, it would be important to check whether the actual radio spectral index could suggest that some fraction of the radio emission is powered by an AGN, as in the case of SPD.81 (H-ATLAS J090311.6+003907; Valtchanov et al. 2011).
4.2. Implication of H2O emission in SDP.17b
As discussed in Sect. 2, the detection of H2O in SDP.17b implies special excitation conditions in an intense infrared radiation field and a warm dense gas, similar to Mrk 231 (e.g. with n(H2) ~ 106 cm-3 and Tdust ~ 100 K). Note, however, that the density is far below the critical densities of H2O (n(H2)crit > 108 cm-3). It is thus impossible to determine the density because the excitation is dominated by the radiation field. Indeed there is currently no information for SDP.17b about other strong emission in H2O lines with higher excitation, as in the case of Mrk 231, and it remains difficult to infer the detailed conditions of the gas from the detection of a single line. However, despite the uncertainty in the amplification factor, clearly the intrinsic H2O line luminosity is at least comparable to that of Mrk 231 (Table 2). Similarly, the ratio I(H2O(202 − 111))/I(CO(8 − 7)) found for SDP.17b (~0.5) is consistent with that found for Mrk 231 (~0.75), but is completely different from standard PDRs (Sect. 2). In addition, the ratio L(H2O)/LIR is three times higher in SDP.17b than in Mrk 231 (2.1 × 10⁻⁵ vs. 0.6 × 10⁻⁵). All the evidence suggests that SDP.17b and Mrk 231 have similar properties. SDP.17b may thus display excitation conditions as special as and a chemistry as rich as those of Mrk 231 (see Sect. 2), suggesting the influence of a luminous AGN.
However, strictly speaking, without observations of other transitions, the excitation of H2O in SDP.17b could be lower than in Mrk 231 and mostly limited to levels with energy ~ 100 K, as the 202 level. As discussed by G-A10, the 202–111 line does not provide unique constraints on the overall excitation conditions, because it can also have a large contribution from gas excited by cooler dust (Tdust ~ 40 K). This excitation might be achieved in less extreme conditions found in warm dense gas over a more extended region, through dense hot cores, and/or via shocks, and is not necessarily associated with excitation by a powerful AGN. But it remains unclear if the above conditions could boost the H2O/CO line intensity ratio to the values that are observed.
We conclude that SDP.17b is likely to be an analogue of Mrk 231. Most of the water lines detected by vdW10 in Mrk 231 could already be detected in SDP.17b or in other lensed sources detected by Herschel (including SDP.81 and HLSW-01) using the PdBI today or during ALMA’s early science phase.
The results reported in this paper are an example of the studies that can be initiated when many bright, lensed high-z submillimeter galaxies become available (through Herschel or other facilities). Follow-up observations of these sources, especially with the increased sensitivities afforded by ALMA or NOEMA, will allow the undertaking of comprehensive studies of molecular lines in sources similar to SDP.17b and provide new insights into the physical conditions of the dense warm molecular gas of high-z SMGs and their AGN.
Acknowledgments
Based on observations carried out with the IRAM Plateau de Bure interferometer. IRAM is supported by INSU/CNRS (France), MPG (Germany) and IGN (Spain). The authors are grateful to the IRAM staff for their support. US participants in H-ATLAS acknowledge support from NASA through a contract from JPL. Italian participants in H-ATLAS acknowledge a financial contribution from the agreement ASI-INAF I/009/10/0. The SPIRE development has been supported by national funding agencies: CSA (Canada); NAOC (China); CEA, CNES, CNRS (France); ASI (Italy); MCINN (Spain); SNSB (Sweden); STFC (UK); and NASA (USA). We also thank the anonymous referee for very helpful suggestions.
References
- Alexander, D. M., Smail, I., Bauer, F. E., et al. 2005, Nature, 434, 738 [NASA ADS] [CrossRef] [PubMed] [Google Scholar]
- Barvainis, R., Tacconi, L., Antonucci, R., et al. 1994, Nature, 371, 586 [NASA ADS] [CrossRef] [Google Scholar]
- Becker, R. H., White, R. L., & Helfand, D. J. 1995, ApJ, 450, 559 [NASA ADS] [CrossRef] [Google Scholar]
- Bradford, C. M., Aguirre, J. E., Aikin, R., et al. 2009, ApJ, 705, 112 [NASA ADS] [CrossRef] [Google Scholar]
- Casoli, F., Gerin, M., Encrenaz, P. J., & Combes, F. 1994, A&A, 287, 716 [NASA ADS] [Google Scholar]
- Combes, F., & Wiklind, T. 1997, ApJ, 486, L79 [NASA ADS] [CrossRef] [Google Scholar]
- Cox, P., Neri, R., Krips, M., Omont, A., et al. 2011, ApJ, submitted [Google Scholar]
- Danielson, A., Swinbank, A., Smail, I., et al. 2011, MNRAS, 410, 1687 [NASA ADS] [Google Scholar]
- Downes, D., Neri, R., Wiklind, T., et al. 1999, ApJ, 513, L1 [NASA ADS] [CrossRef] [Google Scholar]
- Eales, S., Dunne, L., Clements, D., et al. 2010, PASP, 122, 499 [NASA ADS] [CrossRef] [Google Scholar]
- Fabian, A. C., Smail, I., Iwasawa, K., et al. 2000, MNRAS, 315, L8 [NASA ADS] [CrossRef] [Google Scholar]
- Fiolet, N., Omont, A., Polletta, M., et al. 2009, A&A, 508, 117 [NASA ADS] [CrossRef] [EDP Sciences] [Google Scholar]
- Fischer, J., Sturm, E., Gonzïlez-Alfonso, E., et al. 2010, A&A, 518, L41 [NASA ADS] [CrossRef] [EDP Sciences] [Google Scholar]
- Frayer, D. T., Harris, A. I., Baker, A. J., et al. 2011, ApJ, 726, L22 [NASA ADS] [CrossRef] [Google Scholar]
- González-Alfonso, E., Smith, H. A., Fischer, J., & Cernicharo, J. 2004, ApJ, 613, 247 [NASA ADS] [CrossRef] [Google Scholar]
- González-Alfonso, E., Smith, H. A., Ashby, M. L. N., et al. 2008, ApJ, 675, 303 [NASA ADS] [CrossRef] [Google Scholar]
- González-Alfonso, E., Fischer, J., Isaak, K., et al. 2010, A&A, 518, L43 [G-A10] [NASA ADS] [CrossRef] [EDP Sciences] [Google Scholar]
- Guélin, M., Salomï, P., Neri, R., et al. 2007, A&A, 462, L45 [NASA ADS] [CrossRef] [EDP Sciences] [Google Scholar]
- Ikarashi, S., Kohno, K., Aguirre, J. E., et al. 2010 [arXiv:1009.1455] [Google Scholar]
- Impellizzeri, C. M. V., McKean, J. P., Castangia, P., et al. 2008, Nature, 456, 927 [NASA ADS] [CrossRef] [PubMed] [Google Scholar]
- Ivison, R. J., Magnelli, B., Ibar, E., et al. 2010, A&A, 518, L31 [NASA ADS] [CrossRef] [EDP Sciences] [Google Scholar]
- Lestrade, J.-F., Combes, F., Salomé, P., et al. 2010, A&A, 522, L4 [NASA ADS] [CrossRef] [EDP Sciences] [Google Scholar]
- Lupu, R. E., Scott, K. S., Aguirre, J. E., et al. 2010, ApJ, submitted [arXiv:1009.5983] [Lu10] [Google Scholar]
- McKean, J. P., Impellizzeri, C. M. V., Bauer, F. E., et al. 2011, MNRAS, 410, 2506 [NASA ADS] [CrossRef] [Google Scholar]
- Meijerink, R., & Spaans, M. 2005, A&A, 436, 397 [NASA ADS] [CrossRef] [EDP Sciences] [Google Scholar]
- Negrello, M., Perrotta, F., Gonzïlez-Nuevo, J., et al. 2007, MNRAS, 377, 1557 [NASA ADS] [CrossRef] [Google Scholar]
- Negrello, M., Hopwood, R., De Zotti, G., et al. 2010, Science, 330, 800 [Ne10] [NASA ADS] [CrossRef] [Google Scholar]
- Oliver, S. J., Wang, L., Smith, A. J., et al. 2010, A&A, 518, L21 [NASA ADS] [CrossRef] [EDP Sciences] [Google Scholar]
- Papadopoulos, P. P. 2010, ApJ, 720, 226 [NASA ADS] [CrossRef] [Google Scholar]
- Riechers, D. A., Weiß, A., Walter, F., & Wagg, J. 2010, ApJ, 725, 1032 [NASA ADS] [CrossRef] [Google Scholar]
- Riechers, D. A., Walter, F., Carilli, C. L., et al. 2011a, ApJ, 726, 50 [NASA ADS] [CrossRef] [Google Scholar]
- Riechers, D. A., Cooray, A., Omont, A., et al. 2011b, ApJ, submitted [Google Scholar]
- Rowan-Robinson, M., Broadhurst, T., Oliver, S. J., et al. 1991, Nature, 351, 719 [NASA ADS] [CrossRef] [Google Scholar]
- Sajina, A., Yan, L., Lutz, D., et al. 2008, ApJ, 683, 659 [NASA ADS] [CrossRef] [Google Scholar]
- Scott, K., Lupu, R. E., Aguirre, J. E., et al. 2011, ApJ, in press [Google Scholar]
- Solomon, P. M., & Van den Bout, P. 2005, ARA&A, 43, 677 [NASA ADS] [CrossRef] [Google Scholar]
- Solomon, P. M., Downes, D., Radford, S. J. E., & Barrett, J. W. 1997, ApJ, 478, 144 [NASA ADS] [CrossRef] [Google Scholar]
- Spergel, D. N., Verde, L., Peiris, H. V., et al. 2003, ApJS, 148, 175 [NASA ADS] [CrossRef] [Google Scholar]
- Swinbank, M., Smail, I., Longmore, S., et al. 2010, Nature, 464, 733 [Google Scholar]
- Valtchanov, I., Virdee, J., Ivison, R., et al. 2011, MNRAS, in press [Google Scholar]
- van der Werf, P., Isaak, K. G., Meijerink, R., et al. 2010, A&A, 518, L42 [vdW10] [NASA ADS] [CrossRef] [EDP Sciences] [Google Scholar]
- Vieira, J. D., Crawford, T. M., Switzer, E. R., et al. 2010, ApJ, 719, 763 [NASA ADS] [CrossRef] [Google Scholar]
- Weiß, A., Walter, F., Scoville, N. Z., et al. 2005, A&A, 438, 533 [NASA ADS] [CrossRef] [EDP Sciences] [Google Scholar]
- Weiß, A., Requena-Torres, M. A., Gïsten, R., et al. 2010, A&A, 521, L1 [NASA ADS] [CrossRef] [EDP Sciences] [Google Scholar]
All Tables
All Figures
|
Fig. 1 Spectrum of the para H2O 202−111 emission line towards SDP.17b, where the velocity scale is centred on its observed frequency at 298.93 GHz (corresponding to z = 2.3049). The rms noise is ~4.7 mJy/beam in 31.6 MHz channels. A Gaussian fit to the H2O spectrum is shown as a solid line while the dotted line shows the underlying dust continuum emission. The H2O line is clearly asymmetric and not well fit by a Gaussian profile. |
| In the text | |
Current usage metrics show cumulative count of Article Views (full-text article views including HTML views, PDF and ePub downloads, according to the available data) and Abstracts Views on Vision4Press platform.
Data correspond to usage on the plateform after 2015. The current usage metrics is available 48-96 hours after online publication and is updated daily on week days.
Initial download of the metrics may take a while.