Free Access
Fig. 7
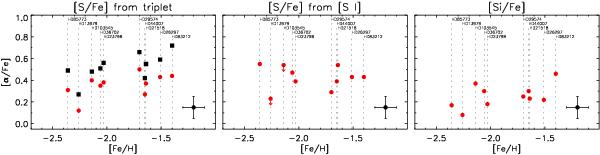
[S/Fe] and [Si/Fe] versus [Fe/H]. The left panel shows LTE sulphur abundances deduced from the 1045 nm triplet in black squares and the non-LTE corrected values in red circles. The middle panel shows the sulphur abundances deduced from the 1082 nm [S i] line. The right panel shows the silicon abundance.
Current usage metrics show cumulative count of Article Views (full-text article views including HTML views, PDF and ePub downloads, according to the available data) and Abstracts Views on Vision4Press platform.
Data correspond to usage on the plateform after 2015. The current usage metrics is available 48-96 hours after online publication and is updated daily on week days.
Initial download of the metrics may take a while.