Free Access
Fig. 5
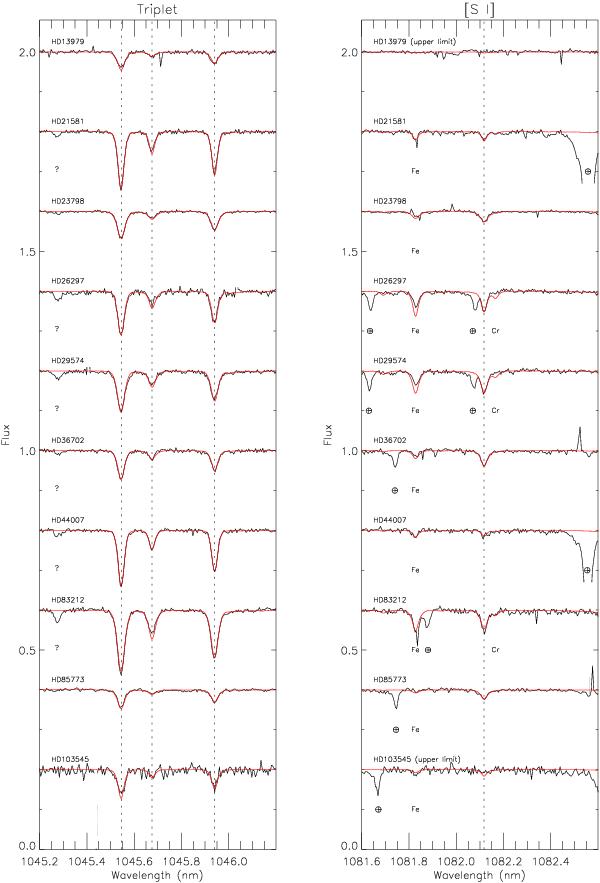
The observed spectra in black and synthetic spectra based on the equivalent width analysis in red. The normalized spectra are shifted by multiples of 0.2 along the flux-axis in the figure. The downward spikes that sometimes occur, e.g. close to the Fe line in HD 83212, are caused by bad pixels.
Current usage metrics show cumulative count of Article Views (full-text article views including HTML views, PDF and ePub downloads, according to the available data) and Abstracts Views on Vision4Press platform.
Data correspond to usage on the plateform after 2015. The current usage metrics is available 48-96 hours after online publication and is updated daily on week days.
Initial download of the metrics may take a while.