Fig. 3
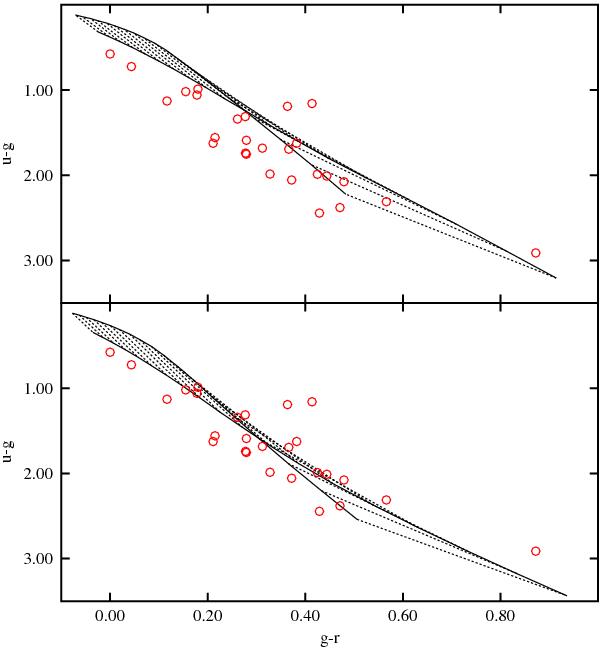
Observed and model colors in the u − g vs. g − r two-color diagram. Top panel: the continuous lines are model values for a temperature sequence from 5400 K (lower right) to 9000 K (upper left) with steps of 200 K. The dotted lines connect the same Teff for 2 different abundances; the upper line in the right half of the figure corresponds to abundances of SDSS0916+2540, the other line to SDSS1103+4144. The (red) circles are the observed data. Bottom panel: the same models, but with the neutral broadening constant for the Mg ii resonance lines increased by a factor of 10 to simulate a stronger blanketing effect in the near ultraviolet.
Current usage metrics show cumulative count of Article Views (full-text article views including HTML views, PDF and ePub downloads, according to the available data) and Abstracts Views on Vision4Press platform.
Data correspond to usage on the plateform after 2015. The current usage metrics is available 48-96 hours after online publication and is updated daily on week days.
Initial download of the metrics may take a while.