| Issue |
A&A
Volume 530, June 2011
|
|
|---|---|---|
| Article Number | A35 | |
| Number of page(s) | 8 | |
| Section | Stellar structure and evolution | |
| DOI | https://doi.org/10.1051/0004-6361/201116801 | |
| Published online | 04 May 2011 | |
Long-period variables in the CoRoT fields⋆
Department of AstronomyUniversity of Vienna, Tuerkenschanzstrasse 17, 1180 Vienna, Austria
e-mail: This email address is being protected from spambots. You need JavaScript enabled to view it.
Received: 28 February 2011
Accepted: 31 March 2011
Abstract
Aims. We searched the first set of data released by the CoRoT mission for red stars showing long-period variability (LPV). These stars are likely highly evolved stars on the upper giant branch. The high time resolution of the CoRoT data allows us to study the light curves of these variables in unprecedented detail.
Methods. Light curves of the reddest stars were extracted from the CoRoT public archive. The search for LPV was done by visual inspection. Instrumental artefacts were removed, and the final light curves were inspected for signs of variability on time scales of hours to a few days. Such abrupt and irregular light curve changes have been reported in the literature to occur in these stars, but their origin is not yet understood.
Results. We detected 52 LPV candidates in four CoRoT fields, most of them previously unknown. No signs of any short-time light changes on time scales between 20 min and a few days and an amplitude exceeding a few mmag could be detected. We conclude that if these short-time variations are physical reality, they must be quite rare events, and we derive a 95% confidence upper limit of 0.15 events per star per year. Any deviations from a perfectly smooth long-time variation are occurring on time scales longer than approximately 10 days.
Key words: stars: AGB and post-AGB / stars: variables: general
The CoRoT space mission, launched on 2006 December 27, was developed and is operated by the CNES, with participation of the Science Programs of ESA, Austria, Belgium, Brazil, Germany, and Spain.
© ESO, 2011
1. Introduction
Since its launch in December 2006, the CoRoT space mission (e.g. Auvergne et al. 2009) produced an abundance of major achievements in the fields of exoplanet search, stellar oscillations, binaries, and surface structures (Bertout et al. 2009). The satellite monitors a small set of fields in the direction of the Galactic centre and anticentre with a very high time resolution. The field of view (FOV) is thereby split into two parts, namely the seismology field and the exoplanet field. While the number of targets in the seismology field is limited to about 10, up to 12 000 targets between R = 11 to 16 mag can be observed in the exoplanet field (e.g. De Ridder 2009). This large number of possible targets allows us to detect and study even types of objects that do not belong to the primary goals of CoRoT.
Long-period variables (LPVs) are cool and highly evolved objects on the asymptotic giant branch (AGB) that show large amplitude radial pulsations on timescales between 30 and several hundred days. Although this variability class has been known for centuries, many details of the variation are still not well understood (e.g. Wood 2000; Lebzelter 2011).
At the first glance, the specifications of the CoRoT mission seem to be not well suited to study this kind of objects. The long-period variations of LPVs, which are additionally altered by irregular changes, require monitoring data over years with a typical sampling rate of a few days, while CoRoT measures a star up to more than 20 000 times during a time span of about 150 days, i.e., the light curve has a sampling rate of approximately 10 min (or 30 min in the case of less frequently sampled targets). However, the high sampling rate and the high photometric precission allow us to study in detail any short-time structures of the light curve on top of the long-period variations.
During the last two decades, the possibility of short-time flares or drops in brightness of LPVs received considerable attention. Schaefer (1991) collected reports of 14 flares in Miras between 1933 and 1975 from the literature. According to Schaefer, eight of them cannot be easily disregarded as artefacts of the measurement process. The events occured on timescales between 3 min and 3 h. Most of them were observed in the visual range and led to variations of several tenths of a magnitude in the brightness of the star. Later, Maffei & Tosti (1995) detected “rapid variations” of 1 to 30 days length in their long-time monitoring of LPVs, affecting about 10% of their sample stars. The most extensive list of short-time flares stems from the study of the Hipparcos light curves of LPVs by de Laverny et al. (1998). These authors report the detection of 51 events of short-time brightness variations in 39 M-type Miras. Amplitudes of these events range from 0.23 to 1.11 mag, and their duration was found to be between 2 h and 6 days. De Laverny et al. suspect that short-time changes in the molecular opacity are responsible for these brightness variations.
These findings motivated several monitoring projects to search for more events. Stencel et al. (2003) report on a ground-based follow-up study of five of the targets in the list of de Laverny et al. (1998) with a higher sampling rate and tentatively confirmed the occurrence of these short time variations. Both studies agree that the events occur primarily but not exclusively close to light minimum. However, an extended study by the same group (Mais et al. 2004) did not find any events at the 0ṃ1 or larger level in two years. Woźniak et al. (2004a) found no indications either for such events in a sample of 485 Miras from the Galactic Bulge studied in the course of OGLE-II with timescales down to 1 day. They set an upper limit of 0.038 events per star per year compared to the Hipparcos event rate of more than 1 star-1 yr-1. The non-detection in the OGLE data may, according to Woźniak et al., be the result of the different spectral band of the study. The OGLE instrument is using the I band while the Hipparcos band is measuring a bluer part of the spectrum. On the modelling side, Willson & Struck (2001) pointed out that the “natural time scales for variations in the atmosphere and wind of a Mira variable are months to years”. They proposed an alternative scenario according to which these events are caused by the interaction of a Jovian planet with the time-dependent outflow of the Mira’s wind, which was later elaborated in more detail in Struck et al. (2002).
From this brief review of the literature it is clear that the existence of short-time light changes in LPVs is still uncertain and requires additional studies. In this paper we use the CoRoT data to study the light change of LPVs on timescales down to minutes in a broad spectral range in the visual covered by CoRoT’s white flux measurements (see below). The photometric accuracy is sufficient to detect outbursts on the level of a few mmag.
2. Sample selection
We searched the archive of public data of the COROT mission that includes data from four long runs (112 to 152 d length), namely LRa01 and LRa02 towards the Galactic anticentre, and LRc01 and LRc02 towards the Galactic centre. Data from short runs were not used with the exception of data for one star that was observed both during a long and a short run. Preselection was done by choosing only stars with spectral type M, luminosity class III, and B − V > 1.8 according to the associated data in the Exodat database (see below). Starting with the objects with the latest spectral subtype (M7), all lightcurves were inspected for LPV characteristics, in particular periodicity exceeding approximately 20 days and light amplitudes of more than 0.1 mag. The search was stopped after checking 300 stars down to M3 because no candidates were found at a spectral type earlier than M4. In a second step we also searched stars with B − V between 1.6 and 1.8 independent of spectral type, and detected a few more candidates. Finally, we included a handful of stars outside this colour range that were kindly brought to our attention by Joris De Ridder, and which the latter found by chance in the search for other kinds of variables.
Because LPVs are found in a quite distinct part of the Hertzsprung Russel diagram (HRD), this approach will allow us to detect most of the candidate stars in the CoRoT data. The rare cases of outliers make it difficult to estimate the completeness of our sample. Naturally, we may also have missed a few objects as the result of possible misidentifications of the photometry in the CoRoT database – below we will discuss a case we detected – or of observing by chance an irregular part of the light curve that gives no indication on the variability class.
3. Data analysis
For the 52 candidates1 finally selected all photometric measurements were extracted from the archive. We found more than 40 LPV candidates among the observed stars in LRc02, but only very few in the other three runs studied. Naturally, less stars will be found in the anticentre direction (LRa01 and LRa02), but the difference here is probably mainly because the exoplanet team preparing the list of targets for CoRoT tried to avoid extremely red stars as unsuitable for planet hunting. CoRoT fluxes were transformed into magnitude scale by mwhite = −2.5 log (flux). We then removed all measurements having non-zero quality flags (e.g. measurements taken during the South Atlantic Anomaly passage) and ended up with typically 16 000 data points per star. Apart from these flagged errors, there are a few systematic shifts in the light curves seen at the same date in a large part of our sample. These jumps are the result of technical problems like a small change in the CCD temperature (Baudin, priv. comm.). The typical size of these shifts is of the order of 0ṃ02, and we removed them by hand. The same was done for some cosmic ray events in individual light curves, which were identified by their characteristic shape (Aigrain et al. 2008).
When the CoRoT dataset covered at least one complete light cycle of a variable, we derived a period for the star using Period98 (Sperl 1998), a code allowing us to do a discrete Fourier transformation in combination with a least-squares fitting of multiple frequencies on the data. Note that this “period” is typically based on one to three complete light cycles and thus may easily be affected by short-time irregularities; long-time periodicities may be missed. For stars with periods exceeding 150 days (110 days for the observing run LRa02) we can only give a lower limit for the length of the light cycle.
The CoRoT Exodat database2 provides BVr′i′ photometry linked to the light curve datasets. These data stem from a pre-launch study by the CoRoT team (Deleuil et al. 2006). The r′i′ photometry in the Sloan-Gunn system was transformed into the (RI)C Cousins system using the relations given in Smith et al. (2002). For all target stars we extracted J, H, and K magnitudes from the 2MASS point source catalogue based on the coordinates given in the header of the CoRoT data file. We also performed a cross correlation of our sample with the General Catalogue of Variable Stars (Samus et al. 2007–2009), the IRAS catalogue (Joint IRAS Science Working Group 1988), the ASAS catalogue of variable stars (ACVS, Pojmanski 2000), and the Northern Sky Variable Survey (NSVS, Woźniak et al. 2004b). In the latter cases we used a search radius of one arcminute to detect possible cross-identifications.
The cross correlation also revealed a few cases where the 2MASS source at the CoRoT target coordinates had an unexpectedly blue colour or a low brightness. In some but not all cases the BVRI photometry gives comparably blue colours as well. A search for other nearby 2MASS objects reveals that there is always a red source within a few arcseconds of the CoRoT position (normally the CoRoT position excellently agrees with the position of the 2MASS source). Inspection of the POSS II image of the area suggests in most cases a nearby source in the visual as well. We suspect that CoRoT either erroneously observed the LPV or that the LPV was within the aperture for the photometry, which is easily possible taking into account the pixel scale of CoRoT which is 2.3′′ (Auvergne et al. 2009). In principle, this effect could hide additional LPVs in the CoRoT database because they may fall out of the photometric selection criteria applied.
LPV candidates detected in the CoRoT field LRc02.
LPV candidates detected in CoRoT field LRa01, LRa02, and LRc01.
4. Results
4.1. General characteristics of the sample
A complete list of LPV candidates found in the CoRoT dataset is given in Tables 1–3. We thereby split the results in stars in LRc02, where we found by far the most candidates, and in other CoRoT fields (Table 2). The stars with no reliable photometry owing to a likely mismatch between CoRoT target and 2MASS source – as described in the previous paragraph – are listed separately in Table 3. For each star we give the corresponding 2MASS identifier, the photometry from the Exodat database transformed into BVRCIC and from 2MASS, the period as derived from the CoRoT light curve, the total observed amplitude of the light change, and any other cross-identifications. To allow for a comprehensive presentation of the results, the stellar coordinates are not given explicitly, but can be easily reconstructed from the 2MASS IDs. Cross-identifications in brackets show uncertain cases. In Fig. 1 we give a few example light curves for illustration. The time axis is in CoRoT Julian Date (CJD) with the origin at January 1, 2000, 12:00. Defects of the light changes resulting from instrumental issues were removed.
From the example light curves, the observed amplitudes, and the derived periods it is obvious that a wide variety of LPVs has been detected by CoRoT, reaching from fairly small amplitude red variables to Miras. Only two of these LPVs have been known as variables before. Eight stars can be associated with an IRAS source, indicating that they are experiencing enhanced mass loss resulting in a considerable emission from circumstellar dust. Six stars of our sample were part of an automatic variability classification of CoRoT data by Debosscher et al. (2009). None of them has been classified as an LPV. This is not surprising taking into account that Debosscher et al. had no LPV in their training set and searched, naturally, only for periods shorter than the length of the CoRoT light curves.
We can try to characterize the LPV candidates even further by using the CoRoT and 2MASS photometry. In Fig. 2 we plot a two-colour diagram of our sample. The stars from field LRc02 form a homogeneous group with a nice relation between J − K and V − IC. The objects from the other three fields are more scattered. For comparison we also show in Fig. 2 the mean location of M-giants taken from Worthey & Lee (2011, solid line). From their large database we selected stars with log g = −0.5 and effective temperature between 2689 and 4031 K. The arrow in the plot indicates the reddening vector based on the numbers given in Mathis (1990). It strongly suggests that all LPVs from LRc02 are M-type giants in the above mentioned temperature range. This is probably also true for two stars from other fields (102994604 and 110742676) that are found in the same part of the diagram as the LRc02 stars. If we attempt to shift these stars (with the exception of the two reddest in J − K) to the relation by Worthey & Lee, we can derive an interstellar absorption AV between 0.8 and 3.5 mag, which seems to agree reasonably with expectations. However, one has to keep in mind that the colours shown here represent only a single epoch (not the same for V − IC and J − K!) and may change significantly over the light cycle. Second, the reddening may not only be due to interstellar but also due to circumstellar reddening. Two stars (101119632 and 101162945) are found close to the two-colour relation of Worthey & Lee and are, thus, obviously more nearby objects that are not significantly affected by interstellar absorption. This also agrees with the fact that 101119632 is more than 2 mag brighter than any other object in our sample.
LPV candidates with uncertain photometry owing to possible misidentification (see text).
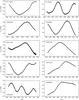 |
Fig. 1 Example light curves representing various kinds of LPVs found in the CoRoT sample. The number in each panel gives the CoRoT-ID. Instrumental artefacts and hot pixel events were removed. |
To understand the remaining sources in the diagram as well, we added to Fig. 2 a series of synthetic photometry from hydrostatic models of C-rich giants from Aringer et al. (2009), and a number of nearby and well known LPVs (asterisks in Fig. 2). The photometry of the latter stems from Mendoza (1967) and was transformed to the same photometric system using the relations given in Bessell (1983). The Mendoza stars located on the extension of the C-star models are all carbon stars. The two CoRoT stars 102659593 and 102760221 found in the same region of the diagram are, thus, likely also carbon stars. Actually, 102659593 has been listed in the Stephenson catalogue of carbon stars (Stephenson 1989). For the two bluest stars in our list of LPV candidates (101123053 and 101279279) we found no explanation.
Several of the CoRoT LPVs have counterparts at the same coordinates in the NSVS, as indicated in the last column of Tables 1 and 2. Unfortuntately, most of these light curves could not be used to confirm or constrain period and an amplitude derived from the CoRoT light curves as the photometric error of the NSVS data is too large. However, in a few cases it was possible to derive some characterizing information, and these stars will be discussed briefly in the next section.
4.2. Individual stars
102760221: for this anticentre star we have CoRoT data from two runs, namely from LRa01 and from the short run IRa01, which lasted only for two months. Combining the data at face value (Fig. 3), the two datasets do not seem to fit together. The second, longer part suggests a period of about 160 days. We may also see a minimum and a maximum in the short part, but that would suggest a timescale for the variations around 100 days. Both parts may be combined by including some long-time brightness trend and assuming a somewhat semiregular variability behaviour.
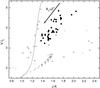 |
Fig. 2 Location of the CoRoT long-period variables in a two-colour diagram. Filled circles mark LPVs from LRc02, while objects from the other three runs investigated are shown as open boxes. The solid line indicates the dereddened location of M-giants according to Worthey & Lee (2011). The astrisks represent the sample of local LPVs given by Mendoza (1967). The small crosses mark the location of hydrostatic C-stars from the models by Aringer et al. (2009). The arrow indicates the direction of the interstellar reddening. |
105317730: this star with a CoRoT amplitude around 0.7 mag (Fig. 1, third row) has a useable NSVS light curve covering almost 2 light cycles, which gives a period of 126 d. However, the overall decline seen in the CoRoT light curves is not visible in the NSVS curve. This CoRoT light curve is also shown as an example for a dataset with a somewhat lower S/N than usual.
105580931: this star has the largest amount of information within our sample. It is a known variable named V900 Oph. The GCVS gives a period of 205 d and a photographic amplitude of more than 2ṃ4. In the ACVS the star is listed with a period of 198 d, although a reanalysis of the ASAS data instead confirms the GCVS period. The V amplitude of 1 mag in the ACVS has to be considered as a lower limit only. The NSVS data lead to a period of 204 d. Extrapolating the CoRoT light curve of this object suggests a period around 195 d and an amplitude of 1ṃ9 in the CoRoT white flux. Light curves from the different sources are summarized in Fig. 4.
105965810: the interesting thing about this star is that the NSVS amplitude is much larger than the CoRoT amplitude (0.5 vs. 0.1 mag, see Fig. 5). Both light curves suggest a similar period, namely 55 d (CoRoT) and 60 d (NSVS). The NSVS light curve is, however, showing strong amplitude variations, and the CoRoT curve might have been obtained during a phase of low amplitude.
105989368: we picked this one out of a handful of similar light curves where the variability period is obviously much longer than the CoRoT time series. As shown in Fig. 1 (fifth row), the CoRoT monitoring covered one maximum, and the overall shape of the light change strongly suggests a classification as a long-period variable, likely a Mira.
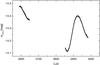 |
Fig. 3 Light curve of CoRoT target 102760221. The two parts correspond to measurements during the runs IRa01 (left) and LRa01 (right), respectively. |
101119632: this is the brightest star in our sample, and one of the two cases where the variability has been detected before. The object is listed as FW Aql in the GCVS, classified as a possible semiregular variable with a period of 340.3 d and a photographic amplitude of 2 mag. The variability was originally detected by Ross (1928). The CoRoT lightcurve, also shown in Fig. 1, is too short to cover a complete light cycle, but because it obviously covers one maximum and one minimum, we can extrapolate a period of 170 to 200 days in that case. The amplitude of the CoRoT curve (white light) is 1ṃ59. Here we can also use the NSVS light curve, which suggests a period of 170 d with a visual light amplitude of 0ṃ9. We, therefore, think that the true (or current) period of FW Aql is about half the value listed in the GCVS. The amplitude may be variable, but this cannot be decided with the existing data.
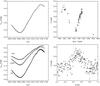 |
Fig. 4 Upper left panel: white light curve of CoRoT target 105580931; lower left panel: blue, green, and red light curve of this star; upper right panel: light curve from NSVS; lower right panel: phased light curve from ACVS applying a period of 205 d. |
5. Discussion
As outlined in the introduction, the high accuracy and high sampling rate of the CoRoT data can be used to study the occurence of light variations in LPVs on very short time scales (less than a few days). Reports in the literature speak about changes of several tenths of magnitudes that should occur once per star per year. For the 52 LPV candidates we have a piece of the light curve of about 41% of a year. The sampling rate allows us to detect any abrupt light change down to a time span of a few minutes, and no shorter variation has been reported. The photometric accuracy of CoRoT in the time domain is of the order of mmag for the magnitude range of our LPVs. Thus, if the frequency is as high as predicted, we should expect to see several such events in our data, even if we restrict the sample to the mira-like variables only (which would correspond to at least 12 stars).
No clear evidence for a short term event could be found in the CoRoT data. Instead, CoRoT’s close-up view of the light change of LPVs reveals an extremely smooth variation (Fig. 1). The only deviations found have amplitudes of less than 0ṃ01 and can most likely be explained as hot pixel events. In Fig. 6 we show the best candidate within our sample for a short time deviation from the smooth long-period variation, which does not show the typical shape of hot pixel events or other instrumental artefacts. It lasted for about two days and had a height above the smooth variation of approximately 0ṃ004. The origin of this feature is not understood.
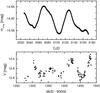 |
Fig. 5 Light curve of CoRoT target 105965810 (upper panel) and the light curve of the same star from NSVS (lower panel). |
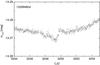 |
Fig. 6 Detail of the CoRoT light curve of 102994604 showing the best case for a possible short-time variation found in the CoRoT sample. |
Woźniak et al. (2004a), who also found no indications for these events in the OGLE data of the Galactic bulge, speculated that either there is a difference between the solar neighbourhood LPVs and the bulge LPVs, or that the events are only visible in the blue part of the spectrum, but not in the I-band. The first argument may be true also for the CoRoT stars observed in the direction of the Galactic centre, and from their I magnitude most of our targets may well belong to the bulge. However, we note that we observed also no flares in the stars in the anticentre, but of course these are much fewer in number.
The second suggestion of Woźniak et al., the observability of these events only in the blue/visual region, does not explain the lack of short-time light changes in the CoRoT LPVs. For our study we used the integrated white flux, which covers the wavelength range from 300 to 950 nm. A light change of a few tenths of magnitude, even if it occurs only in a narrow wavelength region, would leave a signature in the white flux that would be detectable at the accuracy of CoRoT.
For the brighter targets the CoRoT database also includes light curves where the flux has been split into three bands (blue, green, and red). Twenty percent of our LPVs have this colour information. An example is given in Fig. 4. In all cases there are no indications for short-time variability. Thus, we conclude that the phenomenon of short-time variations in LPVs reported in the literature is occuring at a much lower frequency than the one expected from the Hipparcos data. Even more, the CoRoT data, together with the results from Woźniak et al., raise strong doubts that short-time events with amplitudes like those reported by de Laverny et al. really exist. They may be the result of some artefact in the Hipparcos observation or data reduction process.
Using the formula given in Woźniak et al. (2004a), we can derive an upper limit for the probability of the occurence of short-time variations in any given long-period variable based on the CoRoT data. With the high sampling rate of the CoRoT data we may safely assume 100% detection efficiency for any events down to about 30 min duration. Then only the total observing time is relevant for the calculation of the 95% confidence upper limit for the rate (cf. Eq. (4) in Woźniak et al.). Our sample consists of 43 stars in observing run LRc02 (145 d length), 7 stars in LRc01 (152 d), 2 stars in LRa01 (131 d), and 2 stars in LRa02 (112 d). This gives a total of 20.5 star years, and the corresponding 95% confidence upper limit is 0.15 events per star per year. While this is slightly higher than the value derived by Woźniak et al. from the 485 OGLE-II stars, it has the advantage of probing directly very short time scales down to about 30 min at high photometric precision. Restricting the sample to the 12 stars with a clearly Mira-like variation (i.e. long period and large amplitude), we end up with an upper limit of 0.6 events per star per year, which is still a factor 2.5 less than the predictions from the Hipparcos results. We stress, however, that we found no indication for short-time variations like those described in de Laverny et al. (1998) in our data.
While on a timescale of hours the variability of LPVs seems to be very smooth, we do find humps in several light curves – similar to those reported in the literature (e.g. Lockwood & Wing 1971). These features show a duration of typically five days or more and can reach amplitudes between a hundredth and several tenths of a magnitude. This seems to be the shortest timescale of variability in the visual in LPVs. We can then expect that any surface variations, e.g. by granulation or large convective cells, will also either occur on a timescale like this, or, if changes are faster, smear out below the detection limit of CoRoT. Models of the red supergiant Betelgeuse by Chiavassa et al. (2010) indeed predict a pattern of bright and dark areas on the stellar surface that would vary on a timescale of weeks. The emerging intensity variations in the visual, however, are difficult to predict and are expected to be comparably small (see e.g. Freytag & Höfner 2008). The humps seen in the CoRoT lightcurves may, therefore, well be related to surface variations, although we note that other explanations exist as well (see e.g. Barthes et al. 1998, who discuss the possibility of a low-order, two-mode resonance in the pulsation of LPVs).
6. Conclusions
CoRoT has observed, mainly by chance, a nice sample of variables that likely belong to the LPV class. Using photometry we could classify most of them as being either M- or C-type stars. The high time resolution and the high photometric accuracy allows one to study the light variation on timescales shorter than one hour. Earlier claims in the literature of short-time brightness variations could not be confirmed. One has to face the possibility that the events reported so far are not physical. If they are real, they seem to be very rare, which makes it difficult to pin down their origin.
Once the CoRoT mission is completed, we plan to publish an updated list of all long-period variables observed by this
satellite. This will allow us to constrain further the upper limit for the rate of sudden brightness changes in long-period variables, or, in the case of a detection of such an event, to provide more detailed insights into this phenomenon.
Because the length of the light curves does not allow us to make a final classification, we stress that we speak about LPV candidates in this paper. However, for easier readability we will sometimes omit the word candidates in the text and call them LPVs only.
Acknowledgments
The work of T.L. was supported by the Austrian Science Fund FWF projects P20046-N16 and P21988-N16. The author wishes to thank Joris De Ridder and Werner Weiss for helpful comments on the manuscript, and Walter Nowotny for fruitful discussions.
References
- Aigrain, S., Collier Cameron, A., Ollivier, M., et al. 2008, A&A, 488, L43 [NASA ADS] [CrossRef] [EDP Sciences] [Google Scholar]
- Aringer, B., Girardi, L., Nowotny, W., Marigo, P., & Lederer, M. T. 2009, A&A, 503, 913 [NASA ADS] [CrossRef] [EDP Sciences] [Google Scholar]
- Auvergne, M., Bodin, P., Boisnard, L., et al. 2009, A&A, 506, 411 [NASA ADS] [CrossRef] [EDP Sciences] [Google Scholar]
- Barthes, D., Mennessier, M. O., Vidal, J. L., & Mattei, J. A. 1998, A&A, 334, L1 [NASA ADS] [Google Scholar]
- Bertout, C., Foreville, T., Langer, N., & Shore, S. 2009, A&A, 506, E1 [NASA ADS] [CrossRef] [EDP Sciences] [Google Scholar]
- Bessell, M. S. 1983, PASP, 95, 480 [NASA ADS] [CrossRef] [Google Scholar]
- Chiavassa, A., Haubois, X., Young, J. S., et al. 2010, A&A, 515, A12 [NASA ADS] [CrossRef] [EDP Sciences] [Google Scholar]
- De Laverny, P., Mennessier, M. O., Mignard, F., & Mattei, J. A. 1998, A&A, 330, 169 [NASA ADS] [Google Scholar]
- De Ridder, J., Barban, C., Baudin, F., et al. 2009, Nature, 459, 398 [Google Scholar]
- Debosscher, J., Sarro, L. M., Lopez, M., et al. 2009, A&A, 506, 519 [NASA ADS] [CrossRef] [EDP Sciences] [Google Scholar]
- Deleuil, M., Moutou, C., Deeg, H. J., et al. 2006, ESA SP-1306, 341 [Google Scholar]
- Freytag, B., & Höfner, S. 2008, A&A, 483, 571 [NASA ADS] [CrossRef] [EDP Sciences] [Google Scholar]
- Joint IRAS Science Working Group 1988, NASA RP-1190 [Google Scholar]
- Lebzelter, T. 2011, ASP Conf. Ser., in press [Google Scholar]
- Lockwood, G. W., & Wing, R. F. 1971, ApJ, 169, 63 [NASA ADS] [CrossRef] [Google Scholar]
- Maffei, P., & Tosti, G. 1995, AJ, 109, 2652 [NASA ADS] [CrossRef] [Google Scholar]
- Mais, D. E., Stencel, R. E., & Richards, D. 2004, JAAVSO, 33, 48 [Google Scholar]
- Mathis, J. S. 1990, ARA&A, 28, 37 [NASA ADS] [CrossRef] [Google Scholar]
- Mendoza, E. E. 1967, BOTT, 4, 144 [Google Scholar]
- Pojmanski, G. 2000, AcA, 50, 177 [Google Scholar]
- Ross, F. 1928, AJ, 38, 144 [NASA ADS] [CrossRef] [Google Scholar]
- Samus, N. N., Durlevich, O. V., et al. 2007–2009, General Catalogue of Variable Stars, 2009yCat....102025S [Google Scholar]
- Schaefer, B. E. 1991, ApJ, 366, L39 [NASA ADS] [CrossRef] [Google Scholar]
- Schlegel, D. J., Finkbeiner, D. P., & Davis, M. 1998, ApJ, 500, 525 [NASA ADS] [CrossRef] [Google Scholar]
- Smith, J. A., Tucker, D. L., Kent, S., et al. 2002, AJ, 123, 2121 [Google Scholar]
- Sperl, M. 1998, Comm. Asteroseism., 111, 1 [Google Scholar]
- Stencel, R. E., Ostrowski-Fukuda, T. A., Jurgenson, C. A., & Phillips, A. 2003, in 12th Cambridge Workshop on Cool Stars, Stellar Systems, and the Sun, ed. A. Brown, G. M. Harper, & T. R. Ayres, University of Colorado, 1074 [Google Scholar]
- Stephenson, C. B. 1989, PW & SO, 3, 53 [Google Scholar]
- Struck, C., Cohanim, B. E., & Willson, L. A. 2002, ApJ, 571, L83 [NASA ADS] [CrossRef] [Google Scholar]
- Willson, L. A., & Struck, C. 2001, JAVSO, 30, 23 [NASA ADS] [Google Scholar]
- Wood, P. R. 2000, PASA, 17, 18 [NASA ADS] [CrossRef] [Google Scholar]
- Worthey, G., Roush, T. L.; Moore, J. M. & Lee, H. 2011, ApJS, 193, 1 [NASA ADS] [CrossRef] [EDP Sciences] [Google Scholar]
- Woźniak, P. R., McGowan, K. E., & Vestrand, W. T. 2004a, ApJ, 610, 1038 [NASA ADS] [CrossRef] [Google Scholar]
- Woźniak, P. R., Vestrand, W. T., Akerlof, C. W., et al. 2004b, AJ, 127, 2436 [NASA ADS] [CrossRef] [Google Scholar]
All Tables
LPV candidates with uncertain photometry owing to possible misidentification (see text).
All Figures
|
Fig. 1 Example light curves representing various kinds of LPVs found in the CoRoT sample. The number in each panel gives the CoRoT-ID. Instrumental artefacts and hot pixel events were removed. |
| In the text | |
|
Fig. 2 Location of the CoRoT long-period variables in a two-colour diagram. Filled circles mark LPVs from LRc02, while objects from the other three runs investigated are shown as open boxes. The solid line indicates the dereddened location of M-giants according to Worthey & Lee (2011). The astrisks represent the sample of local LPVs given by Mendoza (1967). The small crosses mark the location of hydrostatic C-stars from the models by Aringer et al. (2009). The arrow indicates the direction of the interstellar reddening. |
| In the text | |
|
Fig. 3 Light curve of CoRoT target 102760221. The two parts correspond to measurements during the runs IRa01 (left) and LRa01 (right), respectively. |
| In the text | |
|
Fig. 4 Upper left panel: white light curve of CoRoT target 105580931; lower left panel: blue, green, and red light curve of this star; upper right panel: light curve from NSVS; lower right panel: phased light curve from ACVS applying a period of 205 d. |
| In the text | |
|
Fig. 5 Light curve of CoRoT target 105965810 (upper panel) and the light curve of the same star from NSVS (lower panel). |
| In the text | |
|
Fig. 6 Detail of the CoRoT light curve of 102994604 showing the best case for a possible short-time variation found in the CoRoT sample. |
| In the text | |
Current usage metrics show cumulative count of Article Views (full-text article views including HTML views, PDF and ePub downloads, according to the available data) and Abstracts Views on Vision4Press platform.
Data correspond to usage on the plateform after 2015. The current usage metrics is available 48-96 hours after online publication and is updated daily on week days.
Initial download of the metrics may take a while.