Fig. 2
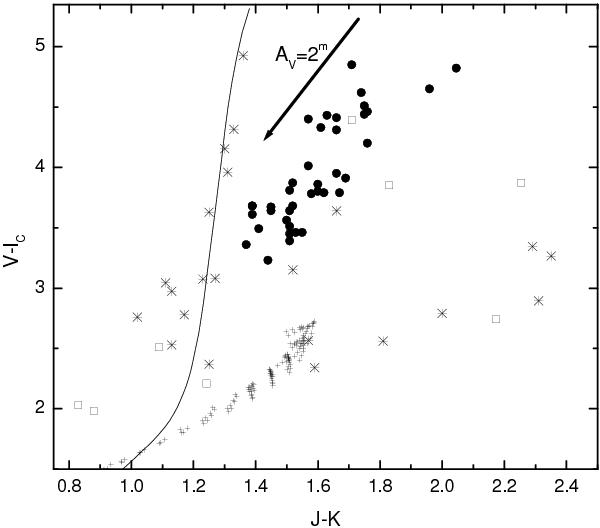
Location of the CoRoT long-period variables in a two-colour diagram. Filled circles mark LPVs from LRc02, while objects from the other three runs investigated are shown as open boxes. The solid line indicates the dereddened location of M-giants according to Worthey & Lee (2011). The astrisks represent the sample of local LPVs given by Mendoza (1967). The small crosses mark the location of hydrostatic C-stars from the models by Aringer et al. (2009). The arrow indicates the direction of the interstellar reddening.
Current usage metrics show cumulative count of Article Views (full-text article views including HTML views, PDF and ePub downloads, according to the available data) and Abstracts Views on Vision4Press platform.
Data correspond to usage on the plateform after 2015. The current usage metrics is available 48-96 hours after online publication and is updated daily on week days.
Initial download of the metrics may take a while.