Fig. 9
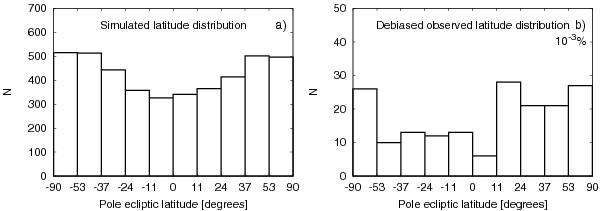
a) Shows the simulated ecliptic latitude distribution of all successfully derived models. In b), the de-biased observed latitude distribution is plotted. The bins are equidistant in sinβ. In the top right corner, there is the probability value of the χ2-test (that the observed distribution is drown from a uniform one, see Table 2).
Current usage metrics show cumulative count of Article Views (full-text article views including HTML views, PDF and ePub downloads, according to the available data) and Abstracts Views on Vision4Press platform.
Data correspond to usage on the plateform after 2015. The current usage metrics is available 48-96 hours after online publication and is updated daily on week days.
Initial download of the metrics may take a while.