Fig. 10
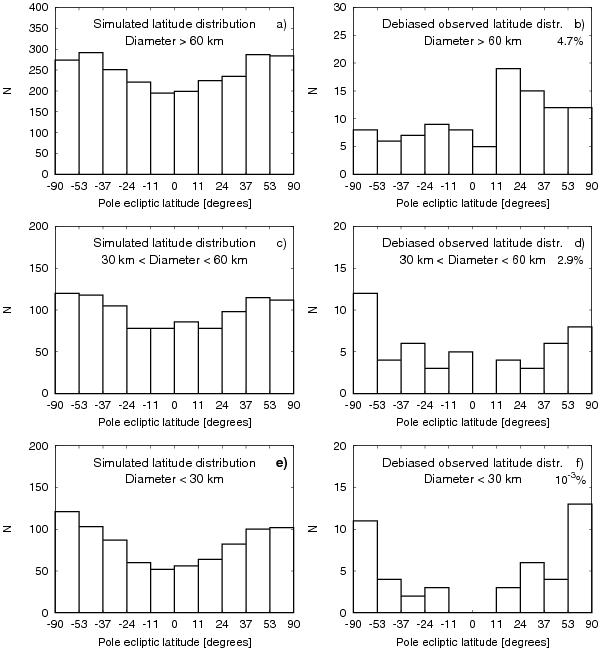
Histograms showing the simulated and corrected (de-biased) observed latitude distributions of MBAs for different size groups, excluding the Koronis cluster members. a) Shows the simulated latitude distribution for asteroids with the diameters larger than 60 km, c) for asteroids with the size in range of 30–60 km, e) for asteroids with diameters smaller than 30 km. Similarly b), d) and f) show the observed latitude distributions corrected by the bias of the LI method. The bins are equidistant in sinβ. In the top right corners, there are the probability values of the χ2-tests (that the observed distributions are drown from a uniform distribution, see Table 2).
Current usage metrics show cumulative count of Article Views (full-text article views including HTML views, PDF and ePub downloads, according to the available data) and Abstracts Views on Vision4Press platform.
Data correspond to usage on the plateform after 2015. The current usage metrics is available 48-96 hours after online publication and is updated daily on week days.
Initial download of the metrics may take a while.