| Issue |
A&A
Volume 530, June 2011
|
|
|---|---|---|
| Article Number | A127 | |
| Number of page(s) | 5 | |
| Section | Stellar atmospheres | |
| DOI | https://doi.org/10.1051/0004-6361/201116633 | |
| Published online | 24 May 2011 | |
About the p-mode frequency shifts in HD 49933
1
Instituto de Astrofísica de Canarias,
38200,
La Laguna, Tenerife,
Spain
e-mail: This email address is being protected from spambots. You need JavaScript enabled to view it.
2
Departamento de Astrofísica, Universidad de La
Laguna, 38206, La
Laguna, Tenerife,
Spain
3
Université de Nice Sophia-Antipolis, CNRS, Observatoire de la Côte
d’Azur, BP 4229,
06304
Nice Cedex 4,
France
4
Institut de Recherche en Astrophysique et Planétologie, CNRS,
14 Av. E. Belin,
31400
Toulouse,
France
5
Université de Toulouse, UPS-OMP, IRAP, 31400
Toulouse,
France
6
Laboratoire AIM, CEA/DSM-CNRS, Université Paris 7 Diderot,
IRFU/SAp, Centre de
Saclay, 91191
Gif-sur-Yvette,
France
7
High Altitude Observatory, NCAR, PO Box 3000, Boulder, CO
80307,
USA
Received: 2 February 2011
Accepted: 27 April 2011
Abstract
We study the frequency dependence of the frequency shifts of the low-degree p modes measured in the F5V star HD 49933, by analyzing the second run of observations collected by the CoRoT satellite. The 137-day light curve is divided into two subseries corresponding to periods of low and high stellar activity. The activity-frequency relationship is obtained independently from the analysis of the mode frequencies extracted by both a local and a global peak-fitting analyses, and from a cross-correlation technique in the frequency range between 1450 μHz and 2500 μHz. The three methods return consistent results. We show that the frequency shifts measured in HD 49933 present a frequency dependence with a clear increase with frequency, reaching a maximal shift of about 2 μHz around 2100 μHz. Similar variations are obtained between the l = 0 and l = 1 modes. At higher frequencies, the frequency shifts show indications of a downturn followed by an upturn, consistent between the l = 0 and 1 modes. We show that the frequency variation of the p-mode frequency shifts of the solar-like oscillating star HD 49933 has a comparable shape to the one observed in the Sun, which is understood to arise from changes in the outer layers due to its magnetic activity.
Key words: stars: oscillations / stars: solar-type / stars: activity / methods: data analysis
© ESO, 2011
1. Introduction
The convective motions in the external layers of solar-like oscillating stars excite acoustic sound waves, which are trapped in the stellar interiors (e.g., Goldreich & Keeley 1977; Goldreich & Kumar 1988). The precise frequencies of these pressure (p) driven waves depend on the properties of the medium in which they propagate. Thus, helio- and asteroseimology are able to infer the properties of the Sun and stellar interiors by studying and characterizing these p modes (e.g., Gough et al. 1996; Metcalfe et al. 2010b). In particular, since the very first helioseismic observations, different authors noticed that near the maximum of the solar magnetic activity cycle, the frequency of the modes were shifted towards higher values (e.g., Woodard & Noyes 1985; Fossat et al. 1987; Pallé et al. 1989; Anguera Gubau et al. 1992). The frequency shifts, which follow an inverse mode-mass scaling (Libbrecht & Woodard 1990), are explained to arise from changes in the outer layers of the Sun along the 11-year cycle (Goldreich et al. 1991; Dziembowski & Goode 2004, 2005). The high-frequency p modes, which have higher upper turning points, are then more sensitive to the perturbations induced by the magnetic field in the outer part of the Sun than the low-frequency p modes, that are less sensitive to the outer layers. Thus, the high-frequency p modes are observed to have large variations with activity, while the low-frequency p modes present little or no variation with activity (e.g., Libbrecht & Woodard 1990; Ronan et al. 1994; Chaplin et al. 1998; Gelly et al. 2002; Salabert et al. 2004; Howe et al. 2008).
As longer, continuous, high-quality helioseismic measurements were collected, the other p-mode oscillation parameters, such as the amplitude, the linewidth, and the asymmetry, were also observed to vary with the solar activity cycle (e.g, Chaplin et al. 2000; Komm et al. 2002; Salabert et al. 2003; Salabert & Jiménez-Reyes 2006; Jiménez-Reyes et al. 2007). While the frequency shifts were proven to be closely correlated with the surface activity proxies over the last three solar cycles (21, 22, and 23) (e.g., Chaplin et al. 2007b), clear differences were recently shown between the global p-mode frequencies and the surface activity of the Sun during the unusually extended minimum of cycle 23 (Broomhall et al. 2009; Salabert et al. 2009; Tripathy et al. 2010). Furthermore, a faster cyclic frequency variations, with a period of about 2 years, was observed to coexist in the Sun (Benevolenskaya 1995; Fletcher et al. 2010), which is believed to have an origin located deeper inside the convective zone.
Magnetic cycles in other stars were already reported by several authors (e.g., Wilson 1978; Baliunas & Vaughan 1985; Baliunas et al. 1995; Hall et al. 2007), and the observed cycles are covering a range between 2.5 and 25 years. Moreover, several authors suggested that the periods of the activity cycles increase proportional to the stellar rotational periods along two distinct paths in main-sequence stars: the active and the inactive stars (Saar & Brandenburg 1999; Böhm-Vitense 2007). Recently, Metcalfe et al. (2010a) uncovered a 1.6-year magnetic activity cycle in the exoplanet host star HD 17051 by measuring the Ca ii H and K emission lines. However, techniques based on spectroscopic measurements are only good proxies of surface magnetic fields (Leighton 1959). Spectropolarimetric observations allow direct measurements of stellar magnetic fields, that has revealed, for instance, reversals of magnetic field polarity during stellar cycles for F and G stars (see Donati et al. 2008; Fares et al. 2009; Petit et al. 2009).
The recent discovery of variations with magnetic activity in the p-mode oscillation frequencies of the F5V star HD 49933 using asteroseismic techniques (García et al. 2010) opens a new era in the study of the physical phenomena involved in the dynamo processes. Indeed, the seismic observables provide invaluable information to pierce inside the stars and determine key parameters for the study of stellar activity, such as the depth of the convection zone, the characteristic evolution time of the granulation, the differential rotation, or the sound-speed as a function of the star’s radius. All these new observables will impose new constraints to the theory (e.g. Chaplin et al. 2007a; Metcalfe et al. 2007). Long, high-quality photometric observations being currently collected by the space-based Convection, Rotation, and planetary Transits (CoRoT, Baglin et al. 2006) and Kepler (Koch et al. 2010) missions will certainly contribute to these studies (e.g. Barban et al. 2009; García et al. 2009; Deheuvels et al. 2010; Mathur et al. 2010a; Chaplin et al. 2010). In this paper, we extend the original analysis from García et al. (2010) by studying the frequency dependence of the activity-frequency relationship.
2. Data analysis
The light curve of HD 49933 was collected during two observational runs from the CoRoT satellite (Appourchaux et al. 2008; Benomar et al. 2009). The first run was performed in 2007 over a period of 60 days, while in 2008 a second run of observations was obtained over 137 days. In the present paper, we analyzed the data from the second run only as it is the longest run and that it corresponds to an important variation in the magnetic activity of HD 49933 and its p-mode frequencies and amplitudes (García et al. 2010). These continuous 137 days of observations were divided into two subseries depending on the activity level of HD 49933 as observed by García et al. (2010). The first 90 days of the original time series correspond to a period of low activity, and the following 47 days correspond to a period of higher activity. Thus, these two subseries optimize the temporal coverage of the observed magnetic activity as well as the frequency resolution. The frequency dependence of the frequency shifts of HD 49933 were obtained by three independent methods: 1) by means of the mode frequencies extracted by a local (method #1) and global (method #2) peak-fitting procedures, and 2) by using a cross-correlation analysis (method #3). Details of the methods are given below. A total of twelve overtones over the frequency range from 1450 μHz up to 2500 μHz of the oscillation power spectrum were analyzed.
2.1. Mode peak-fitting methods
The power spectrum of the two subseries was obtained in order to extract estimates of the p-mode parameters. The mode identification provided by Benomar et al. (2009) was adopted. The stellar background was modeled using six free parameters as in Mathur et al. (2010b) and the individual frequencies from Benomar et al. (2009) were taken as initial guesses. Both local and global peak-fitting techniques were used. The local peak-fitting procedure was performed by fitting sequences of successive series of l = 0, 1, and 2 modes using a maximum-likelihood estimator (method #1). The individual l = 0, 1, and 2 modes were modeled using a single Lorentzian profile for each of the angular degrees l. Therefore, neither rotational splitting nor inclination angle were included in the fitting model. The amplitude ratios between the l = 0, 1, and 2 modes were fixed to 1, 1.5, and 0.5 respectively, and only one linewidth was fitted per radial order. Although the l = 2 modes are visible in the power spectrum, the accuracy of their frequency measurements is rather small compared to the l = 0 and 1 modes (see for instance, Table 1 of Benomar et al. 2009). We decided then to use only the l = 0 and 1 modes to calculate the frequency shifts from the individual mode frequencies extracted with the method #1. Because the very short mode lifetimes in HD 49933, the l = 2 modes are blended with the neighboring l = 0 modes, which makes the determination of the l = 0 and 2 mode frequencies strongly negatively correlated, especially at high frequency where the modes are broader. Due to this strong blending, we decided to determine the centroid of the even l modes by fitting each pair l = 0 and 2 with a single Lorentzian profile. We then performed a global fitting of the spectrum including the stellar background and about 20 Lorentzian profiles (method #2). The frequencies obtained for the even pairs of modes correspond to a weighted average of the l = 0 and l = 2 frequencies, the weights being the relative visibilities of the modes. If we assume: 1) that the relative amplitude between the l = 0 and 2 modes does not change either with frequency or with the activity level, and 2) that the frequency shifts depend mainly on the frequency, i.e. that close pairs of l = 0 and 2 modes have similar activity-induced frequency variations, then the shift measured for the even centroids is equal to the shift of the l = 0 modes. Note also that the fitted frequencies for the odd pairs of modes correspond to the l = 1 frequencies, as the l = 3 modes have neglecting contributions. The mode parameters thus extracted from methods #1 and #2 were checked to be consistent within the errors with Benomar et al. (2009). For both methods #1 and #2, the frequency shifts δνl were obtained by subtracting the individual frequencies measured during the 47-day period of high magnetic activity and the 90-day period of low magnetic activity (similarly to what is performed with the Sun, see e.g., Salabert et al. 2004). Additionally, we analyzed the temporal variations of the mode amplitudes and linewidths, but the results are not reliable due to a poor determination of these parameters at the level of precision of the data.
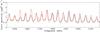 |
Fig. 1 Smoothed power spectra of the 90-day period of low stellar activity (black) and of the 47-day period of high activity (red) of the analyzed observations of HD 49933 represented over the frequency range between 1440 and 2170 μHz. |
2.2. Cross-correlation method
The cross-correlation method was first used by Pallé et al. (1989) in order to measure the solar frequency shift from one single instrument. In our case, the power spectrum of the 47 days at high activity was correlated with the power spectrum of the 90 days at low activity (method #3). As the two datasets do not have the same number of days, the shortest subseries was zero-padded in order to have the same number of bins in both power spectra. The background noise was modeled as in Sect. 2.1, and subtracted from the power spectra. To obtain the frequency shift, a Gaussian profile was fitted to the cross-correlation function to estimate its maximum, the Gaussian profile being centered at the position given by the skewness of the cross-correlation function to avoid any bias due to asymmetry. Thus, the centroid of the fitted Gaussian returned the amount of shift in frequency, the associated uncertainty being given by the 1σ error bar of the fit. While the local and global peak-fitting methods allow us to study the frequency shifts of the individual modes separately (Sect. 2.1), the cross-correlation method returns a global value of the frequency shift for all the visible modes in the power spectrum. In order to obtain estimates of the frequency shifts for the even and odd pairs of modes, two set of spectra were obtained from each spectra. These new spectra were built by extracting the points containing only the frequency windows of the corresponding odd or even pairs, and creating thus a new array of points. Then, the cross-correlation functions were calculated in the same manner as previously and the associated frequency shifts of the even and odd pairs of modes returned.
3. Results
The power spectra of HD 49933 corresponding to the 90-day period of low stellar activity and the 47-day period of higher activity are shown in Fig. 1 between 1440 and 2170 μHz. For illustrative purpose, the spectra were heavily smoothed over 20 μHz, which is comparable to twice the mode linewidth at high frequency (see Fig. 4 in Benomar et al. 2009). Both power spectra overlap in frequency in the low-frequency range below 1780 μHz, while a positive shift becomes visible as the mode frequency increases during the period of higher stellar activity. We note the presence of a prominent peak at about 1690 μHz in the 47-day power spectrum of high activity. We checked that it does not correspond to a harmonic of the spacecraft orbit, therefore it might have an instrumental origin. Figure 2 shows the frequency shifts of HD 49933 as a function of frequency measured between the periods of high and low activity using the results from the local peak-fitting analysis (method #1). Similar results are obtained with the global peak-fitting analysis (method #2). A frequency dependence of the l = 0 and 1 p-mode frequency shifts can be observed. The mean frequency shifts between consecutive l = 0 and 1, using the formal errors as weights, are also represented. The frequency shift increases with frequency up to about 2100 μHz to reach a maximum of ~2 μHz, followed by a downturn with a reversal of the sign down to about −1.5 μHz at ~2300 μHz for the mean frequency shift. Moreover, this downturn might be followed by an upturn for frequencies above 2300 μHz. The individual l = 0 and l = 1 modes have, within the errors, similar variations with frequency. But the l = 1 frequency shifts are overall better constrained than the l = 0 frequency shifts because of the small amplitude of the l = 3 modes in the power spectrum. Besides, the l = 1 modes are observed to have a deeper downturn above 2100 μHz than the l = 0 modes. Nevertheless, these downturn and upturn, although consistent between the l = 0 and l = 1 frequency shifts, occur when the SNR of the modes start to get small. Thus we cannot exclude any effects due to the low SNR to explain the behavior of the frequency shifts at high frequency. Longer datasets will be needed to improve the SNR of the measurements in order to confirm the observed shifts at high frequency. However, if they are real, these reversals of the sign at high frequencies can be qualitatively explained by changes in chromospheric magnetic field and temperature (Johnston et al. 1995). The insert in Fig. 2 shows the increasing part of the mean frequency shift up to 2100 μHz, which would reflect structural changes in and just below the photosphere with stellar activity if we suppose similar mechanisms as in the Sun (see, e.g., Goldreich et al. 1991). The solid red line, which corresponds to a weighted linear fit, clearly shows the increase in frequency shift as a function of frequency. We note the excellent agreement with the results from the cross-correlation method (horizontal dashed lines). We also calculated the variations of the mean mode amplitude as a function of frequency using the same methodology as in García et al. (2010), but by separating the power spectrum into two regions. But no reliable results were obtained due to the very large uncertainties related to the reduced frequency ranges.
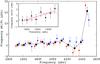 |
Fig. 2 Frequency shifts of the l = 0 (blue squares) and l = 1 modes (red diamonds) of HD 49933 as a function of frequency obtained from method #1. The corresponding weighted mean values of the frequency shift between consecutive l = 0 and 1 modes are represented by the black dots (solid line). A zoom-in on the frequency range up to 2100 μHz is shown in the insert, which represents the mean frequency shift. The horizontal blue dashed lines correspond to the frequency shifts obtained with the cross-correlation method (#3). The solid red line corresponds to a weighted linear fit. |
Table 1 gives the mean frequency shifts obtained from the local analysis of the individual mode frequencies (method #1) averaged between 1470 μHz and 1815 μHz, and between 1815 μHz and 2160 μHz, using the formal errors as weights. These frequency ranges were chosen to contain the same number of overtones of l = 0 and l = 1 modes, and correspond to the represented frequency shifts in the insert of Fig. 2. The results obtained over the same frequency ranges from the analyses from the global fitting of the p-mode spectrum (method #2) and the cross-correlation technique (method #3) are also given in Table 1. The three independent methods agree within the 1σ errorbars. The l = 0 modes – and the even pair of modes (l = 0,2) as well – are observed to have, in average, larger frequency shifts than the l = 1 modes. The total amount of change in mode frequency between periods of low and high stellar activity of HD 49933 is consistent with the temporal variation of the mode frequencies with magnetic activity measured by García et al. (2010). In order to check the consistency of the results, we also analyzed two subseries of 50 days each, centered on the period of low activity and on the rising phase of the magnetic activity. Similar results as Fig. 2 and Table 1 were obtained from the mode peak-fitting and the cross-correlation methods. For example, Fig. 3 compares the mean frequency shifts obtained from the analysis of the 90-day and 47-day subseries with those from the analysis of the two 50-day subseries in the case of the local mode peak-fitting analysis (method #1). The associated Pearson’s linear correlation coefficient is about 0.89.
The frequency dependence of the frequency shifts measured in HD 49933 is comparable in shape to the one observed in the Sun, using both global (e.g., Libbrecht & Woodard 1990; Chaplin et al. 1998; Gelly et al. 2002; Salabert et al. 2004) and local (e.g., Howe et al. 2008) helioseismic measurements. That indicates then the presence of similar physical phenomena driving the frequency shifts of the modes of oscillation as the ones taking place in the Sun, which are understood to arise from changes in the outer layers of the star along its activity cycle. However, the frequency shift measured in HD 49933 is at least five times larger than in the Sun, which is of about 0.5 μHz at 3700 μHz between the maximum and the minimum of the 11-year solar cycle (e.g. Salabert et al. 2004).
Mean frequency shifts ⟨ δνl ⟩ in μHz over two frequency ranges obtained from the local and global mode peak-fitting, and the cross-correlation analyses for HD 49933.
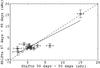 |
Fig. 3 Comparison between the frequency shifts obtained from the analysis of the 90-day and 47-day subseries with those from the analysis of the two 50-day subseries in the case of method #1. The solid line corresponds to the linear fit between the data, and the dashed line represents the 1:1 correlation. |
4. Summary
The p-mode frequencies and amplitudes of the solar-like oscillating star HD 49933 were observed to vary in time with the magnetic activity of the star (García et al. 2010). We studied here the frequency dependence of the p-mode frequency shift by analyzing the same observations as Benomar et al. (2009) and García et al. (2010) collected by the CoRoT satellite. The frequency shifts were obtained independently through the analysis of the mode frequencies extracted by both a local and a global peak-fitting procedures, and through a cross-correlation method. We showed that the frequency shifts in HD 49933 increase with frequency reaching a maximum of about 2 μHz at 2100 μHz. We also inferred that the observed variations in mode frequencies are related to changes in the outer layers of HD 49933 due to its magnetic activity, as the activity-frequency relationship with frequency is analogous in shape to the one observed along the 11-year solar cycle. HD 49933 is thus the second star after the Sun for which the frequency dependence of the p-mode frequency shifts with magnetic activity has been measured.
Acknowledgments
The authors thank the referee of this paper for providing useful comments that improved the presentation. The CoRoT space mission has been developed and is operated by CNES, with contributions from Austria, Belgium, Brazil, ESA (RSSD and Science Program), Germany and Spain. D.S. acknowledges the support from the Spanish National Research Plan (grant PNAyA2007-62650) and from CNES. This work was supported by the CNES/GOLF grant and the “Programme National de Physique Stellaire” at SAp/CEA-Saclay. The National Center for Atmospheric Research is sponsored by the US National Science Foundation.
References
- Anguera Gubau, M., Pallé, P. L., Perez Hernandez, F., Régulo, C., & RocaCortés, T. 1992, A&A, 255, 363 [NASA ADS] [Google Scholar]
- Appourchaux, T., Michel, E., Auvergne, M., et al. 2008, A&A, 488, 705 [NASA ADS] [CrossRef] [EDP Sciences] [Google Scholar]
- Baglin, A., Michel, E., Auvergne, M., & The COROT Team 2006, in Proc. SOHO 18/GONG 2006/HELAS I, Beyond the spherical Sun, ed. K. Fletcher, & M. Thompson, ESA SP-624, Noordwijk, 34 [Google Scholar]
- Baliunas, S. L., & Vaughan, A. H. 1985, ARA&A, 23, 379 [NASA ADS] [CrossRef] [Google Scholar]
- Baliunas, S. L., Donahue, R. A., Soon, W. H., et al. 1995, ApJ, 438, 269 [NASA ADS] [CrossRef] [Google Scholar]
- Barban, C., Deheuvels, S., Baudin, F., et al. 2009, A&A, 506, 51 [NASA ADS] [CrossRef] [EDP Sciences] [Google Scholar]
- Benevolenskaya, E. E. 1995, Sol. Phys., 161, 1 [NASA ADS] [CrossRef] [Google Scholar]
- Benomar, O., Baudin, F., Campante, T. L., et al. 2009, A&A, 507, L13 [NASA ADS] [CrossRef] [EDP Sciences] [Google Scholar]
- Böhm-Vitense, E. 2007, ApJ, 657, 486 [NASA ADS] [CrossRef] [Google Scholar]
- Broomhall, A.-M., Chaplin, W. J., Elsworth, Y., Fletcher, S. T., & New, R. 2009, ApJ, 700, L162 [NASA ADS] [CrossRef] [Google Scholar]
- Chaplin, W. J., Elsworth, Y., Isaak, G. R., et al. 1998, MNRAS, 300, 1077 [NASA ADS] [CrossRef] [Google Scholar]
- Chaplin, W. J., Elsworth, Y., Isaak, G. R., et al. 2000, MNRAS, 313, 32 [NASA ADS] [CrossRef] [Google Scholar]
- Chaplin, W. J., Elsworth, Y., Houdek, G., & New, R. 2007a, MNRAS, 377, 17 [NASA ADS] [CrossRef] [Google Scholar]
- Chaplin, W. J., Elsworth, Y., Miller, B. A., Verner, G. A., & New, R. 2007b, ApJ, 659, 1749 [NASA ADS] [CrossRef] [Google Scholar]
- Chaplin, W. J., Appourchaux, T., Elsworth, Y., et al. 2010, ApJ, 713, L169 [NASA ADS] [CrossRef] [Google Scholar]
- Deheuvels, S., Bruntt, H., Michel, E., et al. 2010, A&A, 515, A87 [NASA ADS] [CrossRef] [EDP Sciences] [Google Scholar]
- Donati, J.-F., Moutou, C., Fars, R., et al. 2008, MNRAS, 385, 1179 [NASA ADS] [CrossRef] [Google Scholar]
- Dziembowski, W. A., & Goode, P. R. 2004, ApJ, 600, 464 [NASA ADS] [CrossRef] [Google Scholar]
- Dziembowski, W. A., & Goode, P. R. 2005, ApJ, 625, 548 [NASA ADS] [CrossRef] [Google Scholar]
- Fares, R., Donati, J.-F., Moutou, C., et al. 2009, MNRAS, 398, 1383 [NASA ADS] [CrossRef] [MathSciNet] [Google Scholar]
- Fletcher, S. T., Broomhall, A.-M., Salabert, D., et al. 2010, ApJ, 718, L19 [NASA ADS] [CrossRef] [Google Scholar]
- Fossat, E., Gelly, B., Grec, G., & Pomerantz, M. 1987, A&A, 177, L47 [NASA ADS] [Google Scholar]
- García, R. A., Régulo, C., Samadi, R., et al. 2009, A&A, 506, 41 [NASA ADS] [CrossRef] [EDP Sciences] [Google Scholar]
- García, R. A., Mathur, S., Salabert, D., et al. 2010, Science, 329, 1032 [NASA ADS] [CrossRef] [PubMed] [Google Scholar]
- Gelly, B., Lazrek, M., Grec, G., et al. 2002, A&A, 394, 285 [NASA ADS] [CrossRef] [EDP Sciences] [Google Scholar]
- Goldreich, P., & Keeley, D. A. 1977, ApJ, 211, 934 [NASA ADS] [CrossRef] [Google Scholar]
- Goldreich, P., & Kumar, P. 1988, ApJ, 326, 462 [NASA ADS] [CrossRef] [Google Scholar]
- Goldreich, P., Murray, N., & Willette, G. 1991, ApJ, 370, 752 [NASA ADS] [CrossRef] [Google Scholar]
- Gough, D. O., Kosovichev, A. G., Toomre, J., et al. 1996, Science 272, 1296 [NASA ADS] [CrossRef] [PubMed] [Google Scholar]
- Hall, J. C., Lockwood, G. W., & Skiff, B. A. 2007, AJ, 133, 862 [NASA ADS] [CrossRef] [Google Scholar]
- Howe, R., Haber, D. A., Hindman, B. W., et al. 2008, in Subsurface and Atmospheric Influences on Solar Activity, ed. R. Howe, R. W. Komm, K. S. Balasubramaniam, & G. J. D. Petrie (San Francisco: ASP), ASP Conf. Ser., 383, 305 [Google Scholar]
- Johnston, A., Roberts, B., & Wright, A. N. 1995, in GONG ’94: Helio- and Astro-Seismology from the Earth and Space, ed. R. K. Ulrich, E. J. Rhodes Jr., & W. Dappen (San Francisco: ASP), ASP Conf. Ser., 76, 264 [Google Scholar]
- Jiménez-Reyes, S. J., Chaplin, W. J., Elsworth, Y., et al. 2007, ApJ, 654, 1135 [NASA ADS] [CrossRef] [Google Scholar]
- Koch, D. G., Borucki, W. J., Basri, G., et al. 2010, ApJ, 713, L79 [NASA ADS] [CrossRef] [Google Scholar]
- Komm, R., Howe, R., & Hill, F. 2002, ApJ, 572, 663 [NASA ADS] [CrossRef] [Google Scholar]
- Leighton, R. B. 1959, ApJ, 130, 366 [NASA ADS] [CrossRef] [Google Scholar]
- Libbrecht, K. G., & Woodard, M. F. 1990, Nature, 345, 779 [Google Scholar]
- Mathur, S., García, R. A., Catala, C., et al. 2010a, A&A, 518, A53 [NASA ADS] [CrossRef] [EDP Sciences] [Google Scholar]
- Mathur, S., García, R. A., Régulo, C., et al. 2010b, A&A, 511, A46 [NASA ADS] [CrossRef] [EDP Sciences] [Google Scholar]
- Metcalfe, T. S., Dziembowski, W. A., Judge, P. G., & Snow, M. 2007, MNRAS, 379, L16 [NASA ADS] [CrossRef] [Google Scholar]
- Metcalfe, T. S., Basu, S., Henry, T., et al. 2010a, ApJ, 723, L213 [NASA ADS] [CrossRef] [Google Scholar]
- Metcalfe, T. S., Monteiro, M. J. P. F. G., Thompson, M. J., et al. 2010b, ApJ, 723, 1583 [NASA ADS] [CrossRef] [Google Scholar]
- Mosser, B., Bouchy, F., Catala, C., et al. 2005, A&A, 431, L13 [NASA ADS] [CrossRef] [EDP Sciences] [Google Scholar]
- Pallé, P. L., Régulo, C., & Roca Cortés, T. 1989, A&A, 224, 253 [NASA ADS] [Google Scholar]
- Petit, P., Dintrans, B., Morgenthaler, A., et al. 2009, A&A, 508, L9 [NASA ADS] [CrossRef] [EDP Sciences] [Google Scholar]
- Ronan, R. S., Cadora, K., & Labonte, B. J. 1994, Sol. Phys., 150, 389 [NASA ADS] [CrossRef] [Google Scholar]
- Saar, S. H., & Brandenburg, A. 1999, ApJ, 524, 295 [NASA ADS] [CrossRef] [Google Scholar]
- Salabert, D., & Jiménez-Reyes, S. J. 2006, ApJ, 650, 451 [NASA ADS] [CrossRef] [Google Scholar]
- Salabert, D., Jiménez-Reyes, S. J., & Tomczyk, S. 2003, A&A, 408, 729 [NASA ADS] [CrossRef] [EDP Sciences] [Google Scholar]
- Salabert, D., Fossat, E., Gelly, B., et al. 2004, A&A, 413, 1135 [NASA ADS] [CrossRef] [EDP Sciences] [Google Scholar]
- Salabert, D., García, R. A., Pallé, P. L., & Jiménez-Reyes, S. J. 2009, A&A, 504, L1 [NASA ADS] [CrossRef] [EDP Sciences] [Google Scholar]
- Tripathy, S. C., Jain, K., Hill, F., & Leibacher, L. W. 2010, ApJ, 711, L84 [NASA ADS] [CrossRef] [Google Scholar]
- Wilson, O. C. 1978, ApJ, 226, 379 [NASA ADS] [CrossRef] [Google Scholar]
- Woodard, M. F., & Noyes, R. W. 1985, Nature, 318, 449 [NASA ADS] [CrossRef] [Google Scholar]
All Tables
Mean frequency shifts ⟨ δνl ⟩ in μHz over two frequency ranges obtained from the local and global mode peak-fitting, and the cross-correlation analyses for HD 49933.
All Figures
|
Fig. 1 Smoothed power spectra of the 90-day period of low stellar activity (black) and of the 47-day period of high activity (red) of the analyzed observations of HD 49933 represented over the frequency range between 1440 and 2170 μHz. |
| In the text | |
|
Fig. 2 Frequency shifts of the l = 0 (blue squares) and l = 1 modes (red diamonds) of HD 49933 as a function of frequency obtained from method #1. The corresponding weighted mean values of the frequency shift between consecutive l = 0 and 1 modes are represented by the black dots (solid line). A zoom-in on the frequency range up to 2100 μHz is shown in the insert, which represents the mean frequency shift. The horizontal blue dashed lines correspond to the frequency shifts obtained with the cross-correlation method (#3). The solid red line corresponds to a weighted linear fit. |
| In the text | |
|
Fig. 3 Comparison between the frequency shifts obtained from the analysis of the 90-day and 47-day subseries with those from the analysis of the two 50-day subseries in the case of method #1. The solid line corresponds to the linear fit between the data, and the dashed line represents the 1:1 correlation. |
| In the text | |
Current usage metrics show cumulative count of Article Views (full-text article views including HTML views, PDF and ePub downloads, according to the available data) and Abstracts Views on Vision4Press platform.
Data correspond to usage on the plateform after 2015. The current usage metrics is available 48-96 hours after online publication and is updated daily on week days.
Initial download of the metrics may take a while.