Fig. 2
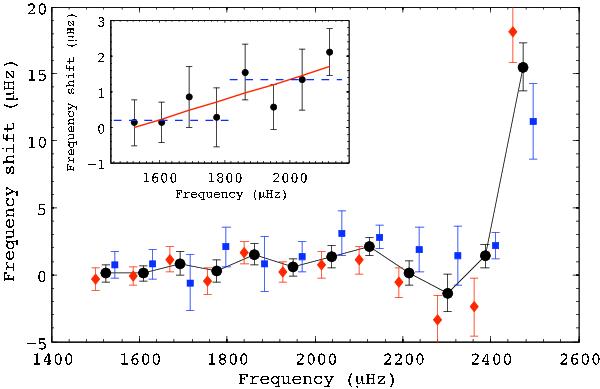
Frequency shifts of the l = 0 (blue squares) and l = 1 modes (red diamonds) of HD 49933 as a function of frequency obtained from method #1. The corresponding weighted mean values of the frequency shift between consecutive l = 0 and 1 modes are represented by the black dots (solid line). A zoom-in on the frequency range up to 2100 μHz is shown in the insert, which represents the mean frequency shift. The horizontal blue dashed lines correspond to the frequency shifts obtained with the cross-correlation method (#3). The solid red line corresponds to a weighted linear fit.
Current usage metrics show cumulative count of Article Views (full-text article views including HTML views, PDF and ePub downloads, according to the available data) and Abstracts Views on Vision4Press platform.
Data correspond to usage on the plateform after 2015. The current usage metrics is available 48-96 hours after online publication and is updated daily on week days.
Initial download of the metrics may take a while.