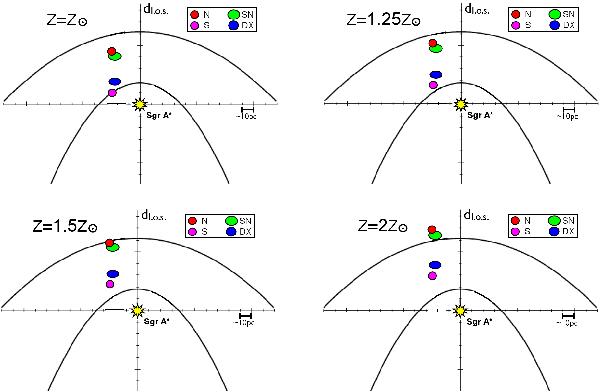
Fig. 6

The relative locations of the four MCs as inferred from the XRN/Sgr A* outburst model suggested by Ponti et al. (2010). This is the view of the Galactic plane as seen from above (i.e. the clouds positions are shown projected onto the plane). The two parabolas in each sketch represent curves of constant path length for a burst of ionizing flux propagating outwards from Sgr A*. The size of each cloud has been enlarged by a factor of 3.5 to aid the visualisation. The distance (in parsecs) along the line of sight (relative to Sgr A*) is plotted along the Y axis (see also Table 5). The SMBH Sgr A* is located at the origin of the axes and marked by a yellow star. The four panels represent the situation for an assumed metallicity of 1, 1.25, 1.5 and 2 times the solar value.
Current usage metrics show cumulative count of Article Views (full-text article views including HTML views, PDF and ePub downloads, according to the available data) and Abstracts Views on Vision4Press platform.
Data correspond to usage on the plateform after 2015. The current usage metrics is available 48-96 hours after online publication and is updated daily on week days.
Initial download of the metrics may take a while.


