Fig. 5
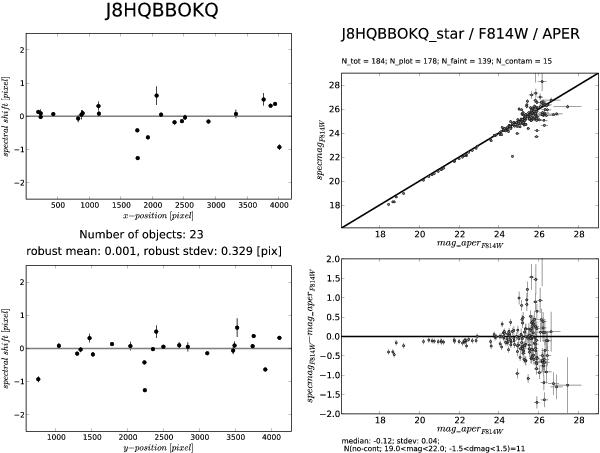
Quality control for association J8HBBOKQ III: the wavelength offset for M-stars identified by cross-correlating extracted spectra with M-star templates (left side). A comparison of the direct imaging magnitudes and the “spectral magnitudes” derived by integrating the spectra over the corresponding filter throughput curve (right side). The comparison of the direct image magnitudes derived with a finite aperture and the “spectral magnitudes” that were computed from the aperture corrected spectra (see Sect. 2.2.6) results in an offset from the zero line.
Current usage metrics show cumulative count of Article Views (full-text article views including HTML views, PDF and ePub downloads, according to the available data) and Abstracts Views on Vision4Press platform.
Data correspond to usage on the plateform after 2015. The current usage metrics is available 48-96 hours after online publication and is updated daily on week days.
Initial download of the metrics may take a while.