Fig. 3
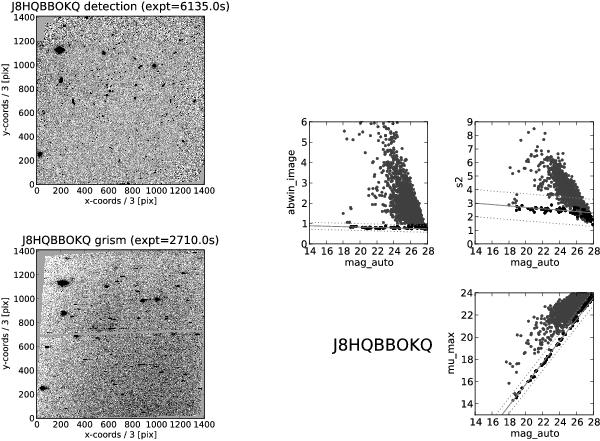
Quality control for association J8HBBOKQ I: the detection image and the co-added grism image (left side); statistical analysis of the object parameters from the detection list (right side). The upper left panel shows the object size, the upper right panel the stellarity parameter s2 (Pirzkal et al. 2009) and the lower right panel the central surface brightness as a function of object brightness. The solid and dotted lines mark the exact locus of point-like objects and the enclosing tolerance area, respectively.
Current usage metrics show cumulative count of Article Views (full-text article views including HTML views, PDF and ePub downloads, according to the available data) and Abstracts Views on Vision4Press platform.
Data correspond to usage on the plateform after 2015. The current usage metrics is available 48-96 hours after online publication and is updated daily on week days.
Initial download of the metrics may take a while.