Fig. 2
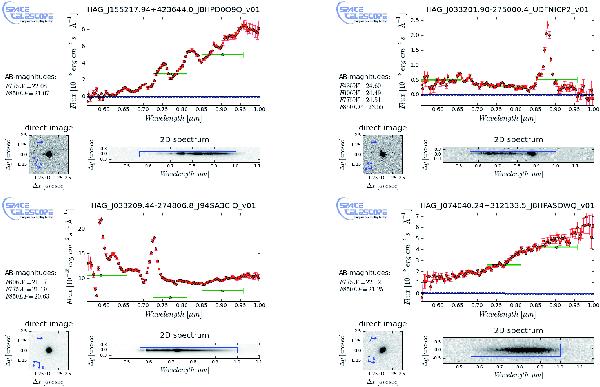
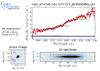
Examples of ACS grism spectra as shown in the previews included in the release. Blue curves (when present) indicate the estimated contamination from near-by sources as a function of wavelength. The green data points (horizontal bars) correspond to the integrated broad band magnitudes. The blue rectangular box in the 2D spectrum shows the effective extracted region where the extraction was performed. In the cutout direct image (taken from the “white light” detection image), the “pseudo-slit” and the dispersion direction are indicated (blue arrow). Top left: an M-star; top right: a low redshift star burst galaxy; bottom left: a broad-absorption line QSO identified as a Chandra X-ray source at z = 2.78 (Szokoloy et al. 2004); bottom right: an early-type galaxy.
Current usage metrics show cumulative count of Article Views (full-text article views including HTML views, PDF and ePub downloads, according to the available data) and Abstracts Views on Vision4Press platform.
Data correspond to usage on the plateform after 2015. The current usage metrics is available 48-96 hours after online publication and is updated daily on week days.
Initial download of the metrics may take a while.