Fig. 14
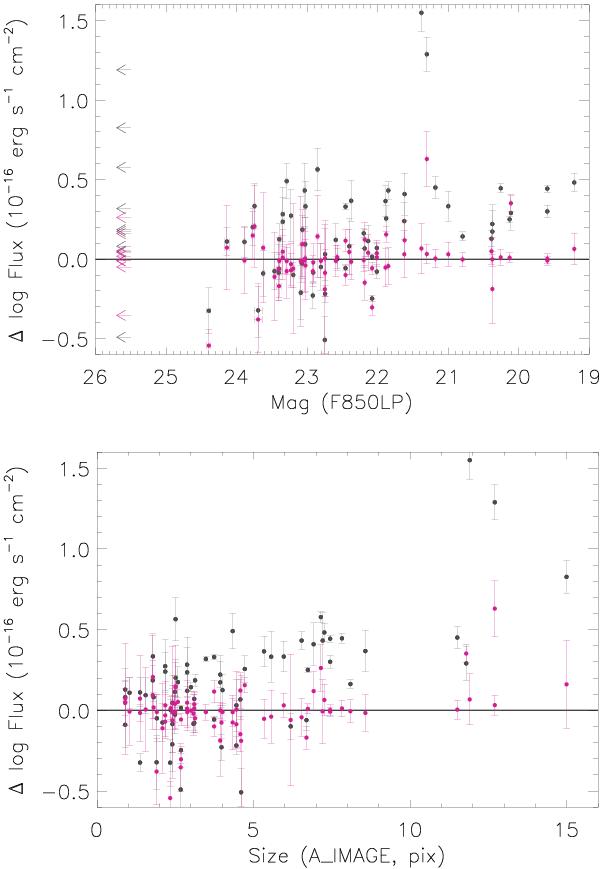
Difference (Δlog Flux as in Fig. 13) in measured line fluxes as a function of overall magnitude in the z band (top) and major axis length as determined in the white light image (bottom). Grey points are results before optimization and red after. Arrows in the upper plot indicate objects with upper limits on their magnitudes. The largest improvement is for large/bright objects, as expected.
Current usage metrics show cumulative count of Article Views (full-text article views including HTML views, PDF and ePub downloads, according to the available data) and Abstracts Views on Vision4Press platform.
Data correspond to usage on the plateform after 2015. The current usage metrics is available 48-96 hours after online publication and is updated daily on week days.
Initial download of the metrics may take a while.