Fig. 13
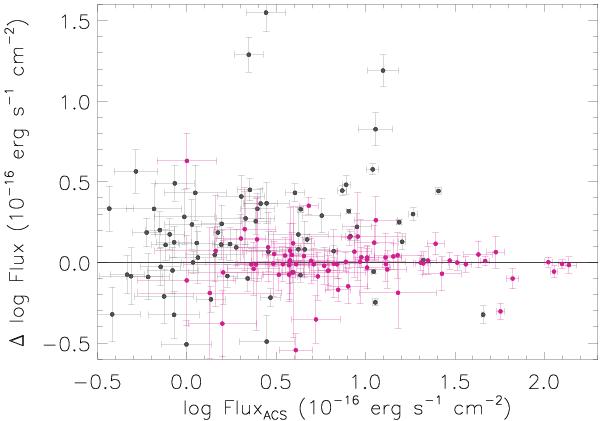
Difference in the emission-line flux measured in the ground-based (GB) and the grism spectra (ACS) (Δlog Flux = log FluxGB − log FluxACS) as a function of the ACS emission-line flux. Grey/red points are before/after a tailored extraction. Only lines with ≥ 3σ detections in both measurements are shown. The solid line indicates a 1:1 relation. Points above the solid line indicate too low flux measurements in the grism spectra.
Current usage metrics show cumulative count of Article Views (full-text article views including HTML views, PDF and ePub downloads, according to the available data) and Abstracts Views on Vision4Press platform.
Data correspond to usage on the plateform after 2015. The current usage metrics is available 48-96 hours after online publication and is updated daily on week days.
Initial download of the metrics may take a while.