Fig. 10
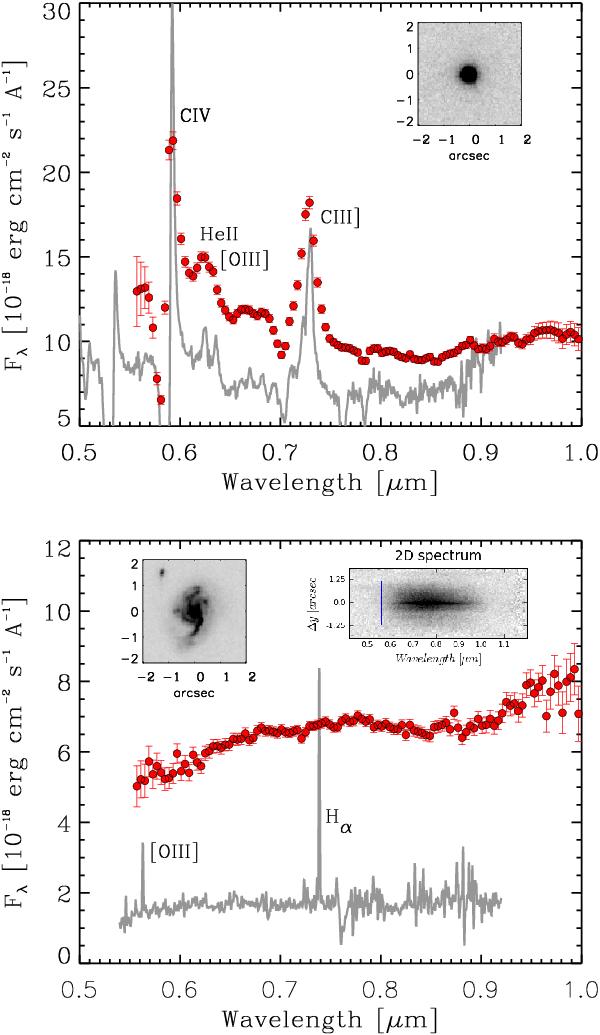
Comparison of the ACS grism spectra (data points with error bars) with ground-based spectra (gray lines). Upper panel: the source HAG_J033209.44-274806.8 identified as a broad absorption line QSO at z = 2.81 by Szokoloy et al. (2004) using VLT/FORS2 spectroscopy with the 150I grism (see Fig. 2 for the full preview image). Lower panel: the source HAG_J033239.83-275652.8, a spiral galaxy at z = 0.125, identified with a VLT/FORS2 spectrum taken with the 300I grism as part of the ESO-GOODS survey (Vanzella et al. 2008). The insets show the direct image stamps and, in the lower panel, also the 2D slitless stamp image.
Current usage metrics show cumulative count of Article Views (full-text article views including HTML views, PDF and ePub downloads, according to the available data) and Abstracts Views on Vision4Press platform.
Data correspond to usage on the plateform after 2015. The current usage metrics is available 48-96 hours after online publication and is updated daily on week days.
Initial download of the metrics may take a while.