| Issue |
A&A
Volume 530, June 2011
|
|
|---|---|---|
| Article Number | A32 | |
| Number of page(s) | 11 | |
| Section | Galactic structure, stellar clusters and populations | |
| DOI | https://doi.org/10.1051/0004-6361/201116452 | |
| Published online | 03 May 2011 | |
Star clusters or asterisms? 2MASS CMD and structural analyses of 15 challenging targets⋆
Universidade Federal do Rio Grande do SulDepartamento de Astronomia, CP 15051, RS, Porto Alegre 91501-970, Brazil
e-mail: This email address is being protected from spambots. You need JavaScript enabled to view it.
; This email address is being protected from spambots. You need JavaScript enabled to view it.
Received: 7 January 2011
Accepted: 29 March 2011
Abstract
Context. Poorly-populated star clusters may have photometric and structural properties not much different from asterisms, to the point that, in some cases, widely-used databases present conflicting classifications.
Aims. We investigate the nature of a sample of challenging targets that have been classified either as star clusters or asterisms in different studies. A few objects are studied for the first time.
Methods. The analysis employs 2MASS photometry, field-star decontamination, to enhance the intrinsic colour–magnitude diagram (CMD) morphology, and colour-magnitude filters, for high contrast stellar radial density profiles (RDPs).
Results. Based on properties derived from field-star decontaminated CMDs, and structural parameters from RDPs, we find that Pismis 12, IC 1434, Juchert 10, Ruprecht 30, NGC 3519, Herschel 1, Mayer 1, and Muzzio 1 are open clusters with ages within 5 Myr − 1.3 Gyr. Ruprecht 129, 130, 140, and 146 are borderline cases, being rather poorly-populated, with evolutionary sequences and RDPs suggesting star clusters. Dolidze 39, BH 79, and Ruprecht 103, have CMDs and RDPs typical of asterisms.
Conclusions. When a low stellar population is associated with a dense field contamination and/or important differential reddening, only a thin line separates star clusters and asterisms. These cases require specific analytical tools to establish their nature.
Key words: open clusters and associations: general / Galaxy: structure
Appendices are available in electronic form at http://www.aanda.org
© ESO, 2011
1. Introduction
Establishing the cluster nature of a stellar overdensity requires meeting criteria stemming from two different perspectives, one related to the spatial distribution of the stars, and the other to the colour-magnitude diagram (CMD) morphology. In short, a star cluster’s overdensity should be spatially extended and present a CMD morphology significantly different from that of the field stars. Otherwise, it may simply be a statistical fluctuation of the field or a low-absorption window, a so-called asterism.
Usually, a star cluster’s overdensity distributes radially from its centre following an analytical profile, such as the single-mass, isothermal spheres of King (1962) and King (1966), the modified isothermal sphere of Wilson (1975), or the power-law with a core of Elson et al. (1987). However, this expectation does not necessarily apply to clusters in all scales. Faint and/or poorly-populated star clusters may have a stellar radial density profile (RDP) that does not follow any analytical profile (e.g. Bonatto & Bica 2008b). Instead, the very poorly-populated ones may have an RDP characterised essentially by a central overdensity together with significant noise outwards, typical features of an asterism (e.g. Fig. 9 of Bonatto & Bica 2008b). In these cases, only the CMD morphology may provide clues to the overdensity nature.
With respect to the photometric properties, the Galactic open clusters (OCs) vary a lot in CMD morphology, such as the presence of evolutionary sequences ranging from a ~1 Myr to a few Gyr (e.g. Bonatto & Bica 2010b,c), including here the very young embedded (in gas and dust) clusters (ECs), which have CMDs dominated by pre-main sequence (PMS) stars (e.g. Ortolani et al. 2008). These clusters can also present significant differences in terms of observable stellar magnitude ranges, the amount of stellar fore/background contamination, as well as foreground and internal differential reddening (especially the ECs). All these aspects should be taken into account when identifying and characterising a star cluster.
Several approaches have been employed to cope with these difficulties, adapted to the available photometric range, but usually in the optical or near infrared (e.g. Bonatto & Bica 2010b; Monteiro et al. 2010; Alessi et al. 2009; Subramaniam et al. 2010). For instance, it is common to find works based on (i) extracted CMDs without applying field star decontamination (e.g. Ortolani et al. 2005); (ii) proper motion-filtering (e.g. Dias et al. 2006) or; (iii) CMD field decontamination (e.g. Bonatto & Bica 2010b). Historically, optical cluster parameters were the main source of information, but in recent years the near-infrared, using mostly the uniform 2MASS1, has become a major data input, especially for reddened clusters. Our group, in particular, has been employing 2MASS CMDs and RDPs built with statistical field decontamination and colour-magnitude filters (Bonatto & Bica 2007). We have studied clusters in different evolutionary stages, since EC formation in complexes (Saurin et al. 2010) to their eventual dissolution (e.g. Bica et al. 2008a; Bonatto & Bica 2009b,a). The respective photometric and structural parameters, have been shown to constrain the study of particular targets.
General data on the targets.
Different targets, in general, require analyses with particular approaches, until getting a clear picture of their nature. However, when the targets are poorly-populated, which applies to most Galactic OCs and ECs, the star cluster characterisation would further require: (i) a cluster nature determination for the first time by means of derivation of fundamental and structural parameters; and (ii) two or more studies on the same object to allow for parameter comparisons and consistency checks.
OC parameters are assembled in two comprehensive and frequently updated databases, WEBDA2 and the “Catalog of Optically Visible Open Clusters and Candidates” (DAML02)3. In some cases, objects have conflicting classifications in both databases. In this respect, Paunzen & Netopil (2006) inspected the status of OC parameters among different studies, finding 72 standard ones with well-determined and consistent values. Their analysis invokes the need of repeated cluster studies to assess the external error of a given parameter. Thus, it is important to derive accurate parameters for newly studied clusters and revisit ambiguous ones with different approaches. Such an effort, in turn, would constantly replenish the OC databases with updated parameters, which is fundamental to obtain external errors. This also would allow assessing OC statistical properties (e.g. Bonatto et al. 2006; Piskunov et al. 2009), and help deepen studies related to star cluster formation and evolution (e.g. Portegies-Zwart et al. 2010).
In the present study we focus on 15 challenging stellar concentrations, in general very field-contaminated and/or absorbed, and either indicated as OC or asterism in previous studies, if any. We analyse the targets with 2MASS data and the tools that we have developed to explore the field-star distribution and/or reddening variations in the area, in view of finding further evidence to confirm or discard any cluster. We propose that such borderline objects can be used as a measure of “cluster nature reproduceability” among different studies, which may be taken as a counterpart to that of Paunzen & Netopil (2006).
This paper is organised as follows. In Sect. 2 we present literature data on the present object sample. In Sect. 3 we discuss the 2MASS photometry and build the field-star decontaminated CMDs. In Sect. 4 we derive fundamental parameters. In Sect. 5 we estimate structural parameters. In Sect. 6 we discuss the nature of the objects according to our analyses, and provide our concluding remarks.
2. Previous results
In Table 1 we condense identification data for the targets, arranged according to the final classification (Sect. 6). Most of the equatorial and Galactic coordinates, as well as angular diameters, were optimised from those in the original catalogues, by means of visual inspections of digitised sky survey DSS and XDSS images4. The data in Table 1 are important as input values for the subsequent analyses, since exceedingly large offsets may affect the convergence of the results. DSS or XDSS images of the targets are shown in Appendix A. In Appendix B we show near-infrared images of the reddened clusters Mayer 1, Muzzio 1, and Juchert 10. Below we discuss what the literature contains about the selected targets.
2.1. Seven Ruprecht targets
Ruprecht objects tend to be relatively faint and field contaminated. They are listed in the classical early catalogue containing OCs and candidates by Alter et al. (1970). Recently, Bonatto & Bica (2010c) studied 15 such neglected Ruprecht clusters using the present method to determine their fundamental and structural parameters. We now extend the analysis to 7 additional Ruprecht objects (hereafter Ru) with dubious classifications, in view of constraining their properties.
Piatti & Clariá (2001b) studied Ru 103, 129, and 146 with BVI photometry concluding that the CMDs do not contain clear evolutionary sequences, and stellar counts do not not show any significant contrast with respect to the background field. Likewise et al. (2001a) did not find any meaningful CMD sequence in the optical range for Ru 140. They concluded that these objects are asterisms, which would be consistent with the rich disk and/or bulge fields against which they are projected (Table 1).
The coordinates of the stellar concentration NGC 3519 (Sinnott 1988) have Ru 93 as counterpart in the OC catalogue of Alter et al. (1970). The object is also present in the ESO/Uppsala catalogue (Lauberts 1982). Kharchenko et al. (2005a) derived the distance from the Sun d⊙ = 1.4 kpc and the age ≈ 440 Myr for NGC 3519. However, Cheon et al. (2010), using optical photometry concluded that no cluster was located in the area.
Piatti et al. (2000) studied Ru 130 by means of BVI photometry and optical integrated spectra, and concluded it to be an OC at d⊙ = 2.1 kpc and 50 ± 10 Myr of age. Paunzen et al. (2006) found d⊙ = 1.8 kpc and 80 ± 20 Myr of age. Similarly to Ru 129, Ru 130 has a remarkable background field, which is consistent with the angular separations of only 0.76° and 1.2°, respectively from the Galactic centre. The populous and very absorbed central bulge is challenging for any analysis method. The present near-infrared tools, with emphasis on field star decontamination, are particularly performing in such cases, especially with the use of colour − magnitude filters (e.g. Bonatto & Bica 2008b).
Vázquez et al. (2008) derived d⊙ = 1.3 ± 0.2 kpc and 60 ± 15 Myr of age for Ru 30. However, Carraro et al. (2010) studied the stellar field in the direction of Ru 30 concluding that no cluster is present.
2.2. Three targets from the sample of Maciejewski & Niedzielski (2008)
Maciejewski & Niedzielski (2008) combined BV and 2MASS photometry with proper motions to analyse doubtful OCs. They concluded that Dolidze 39, IC 1434, and Mayer 1 were composed of physically unrelated stars. However, by means of proper motions, DAML02 finds that Dolidze 39 is an OC at d⊙ = 1.4 kpc. Tadross (2009) employed 2MASS photometry without field decontamination and indicated that IC 1434 is an OC at d⊙ = 3.0 kpc and with 320 Myr of age. Kharchenko et al. (2005a), using 2MASS data and proper motions, concluded that Mayer 1 is a cluster of 55 Myr of age, located at 1.4 kpc from the Sun, and reddening E(B − V) = 0.4.
We note that Dolidze 39 is apparently related to a nebula. It is projected on the Cygnus OB 1 Association. We will check in particular if PMS stars occur in the area, which would be consistent with the young age. Mayer 1 has faint extended nebulosities in the area, both in B and R CADC images. Again, PMS stars may be present.
2.3. Additional targets
Herschel 1 was found by John Herschel (Herschel 1827) and described as a triple star in a small cluster. This stellar concentration was probably not included in the later catalogues of non-stellar objects because of his focus at the time on the double star catalogue. The triple star was also included in the double star catalogue of Aitken (1932) as the triple ADS 6366. SIMBAD5 lists the ADS members as HD 63065 (spectral type B9), BD+00 2080 (A2), and BD+00 2079C (F5IV). Kharchenko et al. (2005b) concluded it to be an OC with 275 Myr of age, located at 370 pc from the Sun, and reddening E(B − V) = 0.02. The object is also included in the FSR survey (Froebrich et al. 2007). Herschel 1 has a detached core, which makes it an interesting target for a detailed structural analysis.
Juchert 10 was reported in the optical by M. Juchert. A private communication of Kronberger to DAML02 in 2005 indicated it as an asterism. The object was as well detected as a GLIMPSE cluster in the far infrared (Mercer et al. 2005). GLIMPSE clusters are also referred to as Mercer and [MCM2005b] clusters (e.g. Hanson et al. 2010; Kurtev et al. 2007). The object has recently been detected in the FSR (Froebrich et al. 2007) and SAI (Glushkova et al. 2010) surveys. The latter authors found an age of ≈ 900 Myr, E(B − V) = 1.48, and d⊙ = 4.02 kpc.
Muzzio (1979) communicated Muzzio 1 as a new OC, possibly related to RCW 38 in Vela. From UBV photometry, he derived a distance of d⊙ = 1.7 kpc for Muzzio 1.
The cluster Pismis 12 was found in the survey of Pismis (1959). Despite being relatively bright (Appendix A), it has not been studied so far (WEBDA; DAML02).
BH 79 was first reported by van den Bergh & Hagen (1975). They communicated a cluster seen in red plates, but not so clearly in the blue. It was concluded to be poor with an angular diameter of 2.5′. We point out that a faint stellar concentration (Table 1) is very close to the original coordinates, and we probe its nature.
3. Photometric analysis
2MASS provides an all-sky coverage, together with spatial and photometric uniformity. These properties are essential for wide angular extractions that, in turn, can be used for statistically characterising the colour and magnitude distribution of the field stars (Sect. 3) and determining the background level (Sect. 5). Thus, to meet these criteria, the photometry for each target was extracted from VizieR6 in a wide circular field of radius Rext = 60 − 90′, varying according to each case. As a photometric quality constraint, only stars with J, H, and Ks errors lower than 0.1 mag are used. Reddening corrections are based on the absorption relations AJ/AV = 0.276, AH/AV = 0.176, AKS/AV = 0.118, and AJ = 2.76 × E(J − H) given by Dutra et al. (2002), with RV = 3.1, considering the extinction curve of Cardelli et al. (1989).
The first step for correctly characterising the photometric and structural properties of a star cluster is to find its actual centre, i.e., the maximum of the overdensity produced by member stars. To do this, we (i) download the photometry centred on the input coordinates (Cols. 4 and 5 of Table 1); (ii) build the RDP (Sect. 5) for deriving a first estimate of target size (R = RRDP) and location of the comparison field (RFS1 ≲ R ≲ RFS2); (iii) build the decontaminated (Sect. 3.1) CMD of the region R ≲ RRDP; (iv) re-compute the central coordinates7, now with the decontaminated photometry, and (v) repeat steps (i) − (iii) for the new central coordinates. Usually, there are small differences between our coordinates (Cols. 8 and 9 of Table 1) and the input ones. The efficiency of this approach can be assessed by the shape of the resulting RDPs (Fig. 5). All cases present a rather high central density dropping relatively smoothly outwards.
CMDs extracted from a region that contains most of the stars (see the respective RDP – Sect. 5) of each target are shown in Figs. 1 to 4 (top panels). These CMDs should be compared to those extracted from equal-area offset fields8 (middle panels). Except for a few cases (e.g. Pismis 12, IC 1434, and Muzzio 1) where a cluster sequence shows up, it is clear that the field contamination has to be taken into account for a proper characterisation of the target.
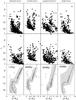 |
Fig. 1 CMDs of Pismis 12, IC 1434, Juchert 10, and Ru 30, for a representative cluster region (top panels) and the equal-area comparison field (middle). The decontaminated CMDs (bottom) are shown together with the isochrone solution (solid line) and the colour-magnitude filter (shaded polygon). Note that, for most stars, the error bars are smaller than the symbol. |
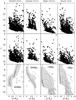 |
Fig. 2 Same as Fig. 1 for NGC 3519, Herschel 1, Mayer 1, and Muzzio 1. PMS tracks correspond to the ages (from top to bottom) 0.2, 1, 5, and 10 Myr in Muzzio 1, reaching to 20 Myr in Mayer 1. A reddening vector for AV = 0 to AV = 5 is shown in the CMDs of Mayer 1 and Muzzio 1. |
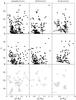 |
Fig. 4 CMDs of the probable asterisms Dolidze 39, BH 79, and Ru 103. |
3.1. Decontaminated CMDs
Our group has been developing a set of analytical tools for disentangling cluster evolutionary sequences from field stars in CMDs. In turn, decontaminated CMDs have been used to investigate the nature of star cluster candidates and derive their astrophysical parameters. Briefly put, field-star decontamination is used to uncover the intrinsic CMD morphology (essential for a proper derivation of reddening, age, and distance from the Sun), and colour − magnitude filters are applied for building intrinsic stellar RDPs. In particular, the use of field-star decontamination with 2MASS photometry in the construction of CMDs has shown to constrain age and distance significantly more than the observed photometry, especially for low-latitude and/or bulge-projected OCs (e.g. Bica et al. 2008b, and references therein). We apply the decontamination algorithm developed in Bonatto & Bica (2007)9. For clarity, we provide a brief description below.
Assume that the region to decontaminate is located within R = RCMD. The algorithm starts by dividing the full range of magnitude and colours of a CMD into a 3D grid of cells with axes along the J magnitude and the (J − H) and (J − Ks) colours. Then, for each cell it computes the total (member + field) number-density of stars, ηtot (for R ≲ RCMD), and estimates the field-star number-density, ηfs (for RFS1 ≲ R ≲ RFS2). Next, it computes the expected number-density of member stars, ηmem = ηtot − ηfs, converts the number-density ηfs into the estimated number of field stars, and subtracts it from each cell. Finally, after subtraction of the field stars, the remaining  stars in each cell are identified for further use (see below). Photometric uncertainties (assumed to be Gaussian) are explicitly taken into account: we compute the probability of a star of given magnitude and colours to be found in a any cell (i.e., the difference of the error function computed at the cell’s borders). Initially, cell dimensions are ΔJ = 1.0 and Δ(J − H) = Δ(J − Ks) = 0.2, but cell sizes half and twice those values are also used. We also apply shifts in the grid positioning by ± 1/3 of the respective cell size in the 2 colours and magnitude axes. When all the different setups are used, the number of independent decontamination outputs amounts to 729.
Each setup results in a total number of member stars  , and the average of Nmem over all setups produces the expected total number of member stars ⟨Nmem⟩. Each star (identified above) is ranked according to the number of times it survives after all runs (survival frequency). Only the ⟨Nmem⟩ highest ranked stars are considered cluster members and transposed to the respective decontaminated CMD. The difference between the expected number of field stars (usually fractional) and the actual number of stars (integer) subtracted from each cell, summed over all cells, is the subtraction efficiency (Further details on the decontamination statistics are in Bonatto & Bica 2007). The above setup, applied to the present targets, resulted in subtraction efficiencies higher than 95%. The decontaminated CMDs are shown in the bottom panels of Figs. 1 to 4.
4. Derivation of fundamental parameters
Fundamental parameters are derived with Padova isochrones (Girardi et al. 2002)10. The isochrones of Siess et al. (2000) are used for characterising the PMS stars. With respect to metallicity, the difference between, e.g. solar and half-solar metallicity isochrones for a given age is small, to within the 2MASS photometric uncertainties (Bonatto & Bica 2010b). Thus, we adopt the solar metallicity isochrones for simplicity.
The isochrone solutions take the constraints provided by the field-decontaminated CMD morphology into account, allowing as well for variations due to photometric uncertainties (which are small, because of the restrictions imposed in Sect. 3), the presence of binaries (which tend to produce a redwards bias in the MS), and differential reddening (especially for Muzzio 1 and Mayer 1). We begin with the isochrones set for zero distance modulus and reddening, and apply shifts in magnitude and colour until a satisfactory (judged by visual inspection) fit is obtained. In this sense, any isochrone that occurs within the photometric error bars is taken as acceptable, and the adopted age and uncertainty simply reflects the acceptable range. The adopted fits are shown in Figs. 1 to 3, and the respective parameters are given in Table 1.
A first look at the decontaminated CMDs suggests OCs in a wide variety of evolutionary stages together with some asterisms. In particular, the presence of somewhat evolved (in different degrees) OCs is suggested by the well-defined CMD morphologies containing giant clumps and red giant branches that show up in some clusters (Figs. 1 − 3). This is particularly true for Pismis 12 (d⊙ ~ 1.9 kpc, ~1.3 Gyr), IC 1434 (~2.6 kpc, ~800 Myr), Juchert 10 (~3.2 kpc, ~800 Myr), and Ru 30 (~5.4 kpc, ~400 Myr). Pismis 12, IC 1434, Juchert 10, and Ru 30 also appear to contain some blue-stragglers. To this group we can also add Muzzio 1 (~1.3 kpc, ~5 Myr) and Mayer 1 (~2.2 kpc, ~10 Myr), which are ECs still containing plenty PMS stars (Fig. 2). Less populous but still showing evidence of being OCs are NGC 3519 (~2.0 kpc, ~400 Myr), the relatively nearby Herschel 1 (~0.35 kpc, ~300 Myr) and the distant and oldest case of the sample, Ru 140 (~3.5 kpc, ~4 Gyr). At a lower degree we have the borderline cases, i.e. those with ambiguous (i.e. morphology not well defined, low statistics, etc.) CMDs: Ru 146 (~1.9 kpc, ~1 Gyr), Ru 130 (~0.9 kpc, ~100 Myr), and Ru 129 (~2.7 kpc, ~500 Myr). Finally, Dolidze 39, BH 79, and Ru 103 appear to be asterisms (Fig. 4). In Sect. 6 we will couple the CMD properties to the structural analysis for establishing the nature of the targets.
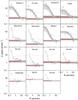 |
Fig. 5 Stellar RDPs before (dotted line) and after (circles) applying the colour − magnitude filters. Also shown is the best-fit King-like profile (solid line), the 1σ uncertainty (light-shaded region) and the residual background level (shaded polygon). The gap in the RDP of Juchert 10 is from a “hole” in 2MASS photometry, due to some very bright stars projected nearby. |
Muzzio 1 and Mayer 1 present CMDs dominated by PMS stars (Fig. 2). In both cases, the rather poorly-populated and nearly vertical (decontaminated) MS accepts any isochrone of age within the range 1−10 Myr as a reasonable fit. A similar age spread is obtained for the PMS stars (allowing as well for the differential reddening), which are basically contained within the 0.2 Myr and 10 Myr (20 Myr in the case of Mayer 1) isochrones. This means that the first stars may have started to form ~10 Myr and ~20 Myr ago in Muzzio 1 and Mayer 1, respectively, with an equivalent time spread for the star formation. Thus, we adopt ~5 Myr as the age of the bulk of the stars in Muzzio 1, and 10 Myr for Mayer 1.
5. Structural analysis
Probable member stars of each target are isolated by applying the respective colour − magnitude filter11 (Figs. 1 to 3). These filters are designed according to the most probable CMD morphology; essentially, they surround the decontaminated CMD sequences. These stars are used to build the RDP, which is the projected stellar radial density profile. In previous papers (e.g. Bonatto & Bica 2010a), we have shown that this procedure enhances the RDP contrast relative to the background, especially in crowded fields.
Both sets of RDPs (before and after applying the colour-magnitude filters) are shown in Fig. 5, where the contrast enhancement due to the filtering is clearly seen in varying degrees. We have tried to fit these RDPs with the function σ(R) = σbg + σ0/(1 + (R/Rc)2), where σ0 and σbg are the central and residual fore/background stellar densities, and Rc is the core radius. This function is similar to that applied by King (1962) to the surface-brightness profiles in the central parts of globular clusters, although here we use it on star counts12. However, only in 6 cases (IC 1434, Pismis 12, Juchert 10, Ru 30, Mayer 1, and Muzzio 1) the fitting converged towards a meaningful solution. The best-fit solutions are shown in Fig. 5, and the structural parameters are given in Table 2. NGC 3519, Herschel 1, and Ru 146, have RDPs that marginally could be represented by the King-like function, but the error bars and RDP fluctuations prevented that. To a lesser degree, the same applies to Ru 129,130,140. On the other hand, Dolidze 39, BH 79, and Ru 103, have RDPs typical of asterisms (e.g. Bonatto & Bica 2008b).
Structural parameters derived from the RDPs.
We also use the RDP and background level to estimate the cluster radius RRDP (Table 2), defined as the distance from the cluster centre where RDP and residual background are statistically indistinguishable. In this sense, RRDP is an observational truncation radius, whose value depends both on the radial distribution of member stars and the field density.
6. Summary and conclusions
In this paper we investigate the nature of 15 challenging stellar overdensities that, in general, have conflicting classifications (star cluster or asterism) in different studies. With a few exceptions, the targets are poorly-populated and/or projected against very dense backgrounds, which might explain the difficulty in establishing their nature. They are: IC 1434, Mayer 1, Herschel 1, Muzzio 1, Pismis 12, NGC 3519, Juchert 10, Dolidze 39, BH 79, Ruprecht 30, 103, 129, 130, 140, and 146.
Our approach involves photometric properties derived from field-star decontaminated CMDs, and structural parameters, derived from highly-contrasted and large-scale RDPs. The field decontamination, in particular, has proven to be essential for deeper analyses on the nature of the targets. This point is particularly obvious when one considers the RDPs (Fig. 5). Prior to field decontamination, most RDPs are similar to those produced by asterisms. In contrast, by eliminating most of the field stars, the decontaminated RDPs of a few cases could be represented by a King-like profile, thus suggesting a cluster. At this point we note that an objective criterion for unambiguous classifying the overdensities would be interesting. However, given the rather different distances, number of member stars, field contamination level, etc, such a criterion based only on the RDP does not seem feasible, since a faint star cluster may have an RDP resembling that of an asterism. In this sense, we apply a subjective selection criterion based on both properties, the decontaminated CMD morphology and RDP. As usual, preference is given to the CMD. Based on this criterion, the targets can be grouped in the three categories below.
Open and embedded clusters:
This group is composed by Pismis 12, IC 1434, Juchert 10, Ruprecht 30, NGC 3519, Herschel 1, Mayer 1, and Muzzio 1, the latter two being ECs. Their decontaminated CMDs (Figs. 1 and 2) present evolutionary sequences of OCs and ECs at different evolutionary stages. Their ages range from 300 Myr to 1.3 Gyr, except for the young ones Mayer 1 and Muzzio 1 that, with ages within 5 − 10 Myr, have CMDs dominated by PMS stars. The RDPs are well represented by a King-like profile, except for Herschel 1 and NGC 3519, whose RDPs present significant deviations.
Borderline cases:
Members of this group are Ruprecht 129, 130, 140, and 146. They have ambiguous CMDs, i.e., although rather poorly-populated, the decontaminated sequences appear to suggest star clusters. However, because of the low statistics, no definitive conclusion can be drawn. Also, their RDPs cannot be represented by the King-like profile. Thus, deeper photometry is required.
Probable asterisms:
Both the CMDs and RDPs of Dolidze 39, BH 79, and Ruprecht 103, appear to arise from field fluctuations. Thus, the photometric and structural criteria indicate that they are asterisms.
A general conclusion is that, in some cases, only a thin line separates properties of star clusters and asterisms (field fluctuations), owing to a low-stellar population, dense field-contamination residuals, and/or significant differential reddening. It is clear that specific analytical tools may be necessary to establish the nature of these difficult cases. Field-decontaminated CMDs and RDPs, which provide a deep and more constrained investigation, appear to be essential for this task.
Online material
Appendix A: DSS/XDSS images
The images have been taken from CADC Sky Survey, with a field of view adequate to the angular dimension of each target. The same applies to the image band.
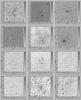 |
Fig. A.1 CADC images of the targets. Clusters are shown from left to right. First row: IC 1434 (B, 15′ × 15′), Mayer 1 (B, 20′ × 20′), Herschel 1 (B, 20′ × 20′); second row: Ru 30 (B, 10′ × 10′), Muzzio 1 (R, 15′ × 15′), Pismis 12 (B, 10′ × 10′); third row: NGC 3519 (B, 10′ × 10′), Juchert 10 (I, 10′ × 10′), Ru 140 (I, 10′ × 10′); fourth row: Ru 146 (B, 10′ × 10′), Ru 130 (R, 6′ × 6′), and Ru 129 (R, 10′ × 10′). |
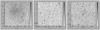 |
Fig. A.2 Same as Fig. A.1 for Dolidze 39 (R, 20′ × 20′), BH 79 (R, 15′ × 15′), and Ru 103 (R, 10′ × 10′). |
Appendix B: 2MASS images
Near-infrared (Ks) images of optically absorbed clusters (Table 1).
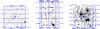 |
Fig. B.1 2MASS Ks images of Mayer 1 (5′ × 5′), Muzzio 1 (5′ × 5′), and Juchert 10 (6′ × 6′). |
The Two Micron All Sky Survey, All Sky data release (Skrutskie et al. 2006) – http://www.ipac.caltech.edu/2mass/releases/allsky/
Extracted from the Canadian Astronomy Data Centre (CADC), at http://cadcwww.dao.nrc.ca/
In the present approach, the centre corresponds to the coordinates that produce the smoothest stellar RDP and, at the same time, the highest density in the innermost region.
The equal-area field extractions are used only for qualitative comparisons, since the decontamination algorithm uses a wide surrounding area (Sect. 3).
A summary of different decontamination approaches is given in Bonatto & Bica (2009a).
http://stev.oapd.inaf.it/cgi-bin/cmd – computed for the 2MASS filters, these isochrones are very similar to the Johnson-Kron-Cousins ones (e.g. Bessel & Brett 1988), with differences of at most 0.01 mag in colour (Bonatto et al. 2004).
Which is wide enough to include MS (and PMS, for the very young clusters) stars, photometric uncertainties, and binaries.
Given the relatively low number of member stars, RDPs are expected to present lower fluctuations than surface-brightness profiles (Bonatto & Bica 2008a).
Acknowledgments
We thank an anonymous referee for important comments and suggestions. We acknowledge support from the Brazilian Institution CNPq. This publication makes use of data products from the Two Micron All Sky Survey, which is a joint project of the University of Massachusetts and the Infrared Processing and Analysis Centre/California Institute of Technology, funded by the National Aeronautics and Space Administration and the National Science Foundation. We also employed the WEBDA database, operated at the Institute for Astronomy of the University of Vienna. The SIMBAD database, operated at CDS, Strasbourg, France, has also been useful.
References
- Aitken, R. G. 1932, in New general catalogue of double stars within 120° of the North Pole, Carnegie Inst. Washington D.C. Publ., 417 [Google Scholar]
- Alessi, B. S., Moitinho, A., & Dias W. S. 2003, A&A, 410, 565 [NASA ADS] [CrossRef] [EDP Sciences] [Google Scholar]
- Alter, G., Balázs, B., Teutsch, J., & Vanysek, J. 1970, in Catalogue of Star Clusters and Associations, Budapest Akademiai Kiado, 2nd edition, ed. G. Alter, B. Balázs, & J. Teutsch [Google Scholar]
- Bessel, M. S., & Brett, J. M. 1988, PASP, 100, 1134 [NASA ADS] [CrossRef] [Google Scholar]
- Bica, E., Bonatto, C., & Dutra, C. 2008a, A&A, 489, 1129 [NASA ADS] [CrossRef] [EDP Sciences] [Google Scholar]
- Bica, E., Bonatto, C., & Camargo, D. 2008b, MNRAS, 385, 349 [NASA ADS] [CrossRef] [Google Scholar]
- Bonatto, C., & Bica, E. 2007, MNRAS, 377, 1301 [NASA ADS] [CrossRef] [Google Scholar]
- Bonatto, C., & Bica, E. 2008a, A&A, 477, 829 [NASA ADS] [CrossRef] [EDP Sciences] [Google Scholar]
- Bonatto, C., & Bica, E. 2008b, A&A, 485, 81 [NASA ADS] [CrossRef] [EDP Sciences] [Google Scholar]
- Bonatto, C., & Bica, E. 2009a, MNRAS, 394, 2127 [NASA ADS] [CrossRef] [Google Scholar]
- Bonatto, C., & Bica, E. 2009b, MNRAS, 397, 1915 [NASA ADS] [CrossRef] [Google Scholar]
- Bonatto, C., & Bica, E. 2010a, A&A, 516, A81 [NASA ADS] [CrossRef] [EDP Sciences] [Google Scholar]
- Bonatto, C., & Bica, E. 2010b, A&A, 521, A74 [NASA ADS] [CrossRef] [EDP Sciences] [Google Scholar]
- Bonatto, C., & Bica, E. 2010c, MNRAS, 407, 1728 [NASA ADS] [CrossRef] [Google Scholar]
- Bonatto, C., Bica, E., & Girardi, L. 2004, A&A, 415, 571 [NASA ADS] [CrossRef] [EDP Sciences] [Google Scholar]
- Bonatto, C., Kerber, L. O., Bica, E., & Santiago, B. X. 2006, A&A, 446, 121 [NASA ADS] [CrossRef] [EDP Sciences] [Google Scholar]
- Cardelli, J. A., Clayton, G. C., & Mathis, J. S. 1989, ApJ, 345, 245 [NASA ADS] [CrossRef] [Google Scholar]
- Carraro, G., Vázquez, R. A., Costa, E., Perren, G., & Moitinho, A. 2010, ApJ, 718, 683 [NASA ADS] [CrossRef] [Google Scholar]
- Cheon, S., Sung, H., & Bessell, M. S. 2010, JKAS, 43, 115 [NASA ADS] [Google Scholar]
- Dias, W. S., Alessi, B. S., Moitinho, A., & Lépine, J. R. D. 2002, A&A, 389, 871 [NASA ADS] [CrossRef] [EDP Sciences] [Google Scholar]
- Dias, W. S., Assafin, M., Flório, V., Alessi, B. S., & Líbero, V. 2006, A&A, 446, 949 [NASA ADS] [CrossRef] [EDP Sciences] [Google Scholar]
- Dutra, C. M., Santiago, B. X., & Bica, E. 2002, A&A, 383, 219 [NASA ADS] [CrossRef] [EDP Sciences] [Google Scholar]
- Elson, R. A. W., Fall, S. M., & Freeman, K. C. 1987, ApJ, 323, 54 [NASA ADS] [CrossRef] [Google Scholar]
- Froebrich, D., Scholz, A., & Raftery, C. L. 2007, MNRAS, 374, 399 [Google Scholar]
- Girardi, L., Bertelli, G., Bressan, A., et al. 2002, A&A, 391, 195 [NASA ADS] [CrossRef] [EDP Sciences] [Google Scholar]
- Glushkova, E. V., Koposov, S. E., Zolotukhin, I. Yu., et al. 2010, AstL, 36, 75 [Google Scholar]
- Hanson, M. M., Kurtev, R., Borissova, J., et al. 2010, A&A, 516, A35 [NASA ADS] [CrossRef] [EDP Sciences] [Google Scholar]
- Herschel, J. F. W. 1827, MNRAS, 1, 25 [NASA ADS] [Google Scholar]
- Kharchenko, N. V., Piskunov, A. E., Röser, S., Schilbach, E., & Scholz, R.-D. 2005a, A&A, 438, 1163 [NASA ADS] [CrossRef] [EDP Sciences] [MathSciNet] [Google Scholar]
- Kharchenko, N. V., Piskunov, A. E., Röser, S., Schilbach, E., & Scholz, R.-D. 2005b, A&A, 440, 403 [NASA ADS] [CrossRef] [EDP Sciences] [Google Scholar]
- King, I. 1962, AJ, 67, 471 [NASA ADS] [CrossRef] [Google Scholar]
- King, I. R. 1966, AJ, 71, 64 [Google Scholar]
- Kronberger, M., Teutsch, P., Alessi, B., et al. 2006, A&A, 447, 921 [NASA ADS] [CrossRef] [EDP Sciences] [Google Scholar]
- Kurtev, R., Borissova, J., Georgiev, L., Ortolani, S., & Ivanov, V. D. 2007, A&A, 475, 209 [NASA ADS] [CrossRef] [EDP Sciences] [Google Scholar]
- Lauberts, A. 1982, ESO/Uppsala survey of the ESO(B) atlas, European Southern Observatory [Google Scholar]
- Maciejewski, G., & Niedzielski, A. 2008, AN, 329, 602 [Google Scholar]
- Mercer, E. P., Clemens, D. P., Meade, M. R., et al. 2005, ApJ, 635, 560 [NASA ADS] [CrossRef] [Google Scholar]
- Monteiro, H., Dias, W. S., & Caetano, T. C. 2010, A&A, 516, A2 [NASA ADS] [CrossRef] [EDP Sciences] [Google Scholar]
- Muzzio, J. C. 1979, AJ, 84, 639 [NASA ADS] [CrossRef] [Google Scholar]
- Ortolani, S., Bica, E., Barbuy, B., & Zoccali, M. 2005, A&A, 439, 1135 [NASA ADS] [CrossRef] [EDP Sciences] [Google Scholar]
- Ortolani, S., Bonatto, C., Bica, E., Momany, Y., & Barbuy, B. 2008, NewA, 13, 508 [NASA ADS] [CrossRef] [Google Scholar]
- Paunzen, E., & Netopil, M. 2006, MNRAS, 371, 1641 [NASA ADS] [CrossRef] [Google Scholar]
- Paunzen, E., Netopil, M., Iliev, I. Kh., et al. 2006, A&A, 454, 171 [NASA ADS] [CrossRef] [EDP Sciences] [Google Scholar]
- Piatti, A. E., & Clariá, J. J. 2001a, A&A, 370, 931 [NASA ADS] [CrossRef] [EDP Sciences] [Google Scholar]
- Piatti, A. E., & Clariá, J. J. 2001b, A&A, 379, 453 [NASA ADS] [CrossRef] [EDP Sciences] [Google Scholar]
- Piatti, A. E., Clariá, J. J., & Bica, E. 2000, A&A, 360, 529 [NASA ADS] [Google Scholar]
- Piskunov, A. E., Kharchenko, N. V., Schilbach, E., et al. 2009, A&A, 507, L5 [NASA ADS] [CrossRef] [EDP Sciences] [Google Scholar]
- Pismis, P. 1959, BOTT, 18, 39 [Google Scholar]
- Portegies-Zwart, S. F., McMillan, S. L. W., & Gieles, M. 2010, ARA&A, 48, 431 [NASA ADS] [CrossRef] [Google Scholar]
- Saurin, T. A., Bica, E., & Bonatto, C. 2010, MNRAS, 407, 133 [NASA ADS] [CrossRef] [Google Scholar]
- Siess, L., Dufour, E., & Forestini, M. 2000, A&A, 358, 593 [NASA ADS] [Google Scholar]
- Sinnott, R. W. 1988, The complete new general catalogue and index catalogues of nebulae and star clusters by J. L. E. Dreyer, ed. R. W. Sinnott (Cambridge: Sky Publishing Corporation and Cambridge University Press) [Google Scholar]
- Skrutskie, M. F., Cutri, R. M., Stiening, R., et al. 2006, AJ, 131, 1163 [NASA ADS] [CrossRef] [Google Scholar]
- Subramaniam, A., Carraro, G., & Janes, K. A. 2010, MNRAS, 404, 1385 [NASA ADS] [Google Scholar]
- Tadross, A. L. 2009, NewA, 14, 200 [Google Scholar]
- van den Bergh, S., & Hagen, G. L. 1975, AJ, 80, 11 [NASA ADS] [CrossRef] [Google Scholar]
- Vázquez, R. A., May, J., Carraro, G., et al. 2008, ApJ, 672, 930 [NASA ADS] [CrossRef] [Google Scholar]
- Wilson, C. P. 1975, AJ, 80, 175 [NASA ADS] [CrossRef] [Google Scholar]
All Tables
All Figures
|
Fig. 1 CMDs of Pismis 12, IC 1434, Juchert 10, and Ru 30, for a representative cluster region (top panels) and the equal-area comparison field (middle). The decontaminated CMDs (bottom) are shown together with the isochrone solution (solid line) and the colour-magnitude filter (shaded polygon). Note that, for most stars, the error bars are smaller than the symbol. |
| In the text | |
|
Fig. 2 Same as Fig. 1 for NGC 3519, Herschel 1, Mayer 1, and Muzzio 1. PMS tracks correspond to the ages (from top to bottom) 0.2, 1, 5, and 10 Myr in Muzzio 1, reaching to 20 Myr in Mayer 1. A reddening vector for AV = 0 to AV = 5 is shown in the CMDs of Mayer 1 and Muzzio 1. |
| In the text | |
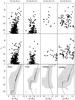 |
Fig. 3 Same as Fig. 1 for the limiting cases Ru 140, 146, 130, and 129. |
| In the text | |
|
Fig. 4 CMDs of the probable asterisms Dolidze 39, BH 79, and Ru 103. |
| In the text | |
|
Fig. 5 Stellar RDPs before (dotted line) and after (circles) applying the colour − magnitude filters. Also shown is the best-fit King-like profile (solid line), the 1σ uncertainty (light-shaded region) and the residual background level (shaded polygon). The gap in the RDP of Juchert 10 is from a “hole” in 2MASS photometry, due to some very bright stars projected nearby. |
| In the text | |
|
Fig. A.1 CADC images of the targets. Clusters are shown from left to right. First row: IC 1434 (B, 15′ × 15′), Mayer 1 (B, 20′ × 20′), Herschel 1 (B, 20′ × 20′); second row: Ru 30 (B, 10′ × 10′), Muzzio 1 (R, 15′ × 15′), Pismis 12 (B, 10′ × 10′); third row: NGC 3519 (B, 10′ × 10′), Juchert 10 (I, 10′ × 10′), Ru 140 (I, 10′ × 10′); fourth row: Ru 146 (B, 10′ × 10′), Ru 130 (R, 6′ × 6′), and Ru 129 (R, 10′ × 10′). |
| In the text | |
|
Fig. A.2 Same as Fig. A.1 for Dolidze 39 (R, 20′ × 20′), BH 79 (R, 15′ × 15′), and Ru 103 (R, 10′ × 10′). |
| In the text | |
|
Fig. B.1 2MASS Ks images of Mayer 1 (5′ × 5′), Muzzio 1 (5′ × 5′), and Juchert 10 (6′ × 6′). |
| In the text | |
Current usage metrics show cumulative count of Article Views (full-text article views including HTML views, PDF and ePub downloads, according to the available data) and Abstracts Views on Vision4Press platform.
Data correspond to usage on the plateform after 2015. The current usage metrics is available 48-96 hours after online publication and is updated daily on week days.
Initial download of the metrics may take a while.