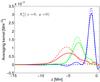
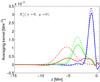
Fig. 27

The cut through the x = y = 0 point of the averaging kernel (solid) and the respective target function (dashed) for the vx (left) and vz (right) inversions using averaging over many flow realisations plotted along with the corresponding target functions at three discussed depths (1 Mm in blue, 3.5 Mm in green, and 5.5 Mm in red). Compare to Figs. 4 and 9 where the resemblance of the target functions is worse. The random error of the results is given in Table 2.
Current usage metrics show cumulative count of Article Views (full-text article views including HTML views, PDF and ePub downloads, according to the available data) and Abstracts Views on Vision4Press platform.
Data correspond to usage on the plateform after 2015. The current usage metrics is available 48-96 hours after online publication and is updated daily on week days.
Initial download of the metrics may take a while.