Fig. 5
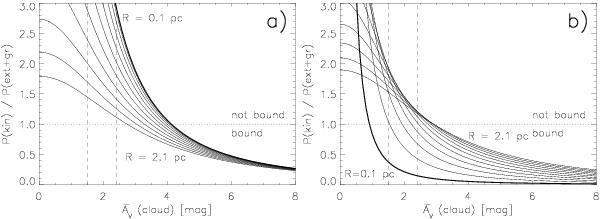
a) Ratio of the pressures supporting a clump against a collapse
(total kinetic pressure) to the pressures promoting it (external and gravitational
pressure) in clumps with  cm-3. The
different curves are for clumps with radii R = 0.1−2.1 pc, in
steps of 0.2 pc. The dashed vertical lines indicate the interval of the observed
mean extinctions (see Table 1). b)
The same, but using Larson’s size-linewidth relation to calculate the kinetic
energies of the clumps (i.e., Eq. (15) instead of Eq. (13)).
cm-3. The
different curves are for clumps with radii R = 0.1−2.1 pc, in
steps of 0.2 pc. The dashed vertical lines indicate the interval of the observed
mean extinctions (see Table 1). b)
The same, but using Larson’s size-linewidth relation to calculate the kinetic
energies of the clumps (i.e., Eq. (15) instead of Eq. (13)).
Current usage metrics show cumulative count of Article Views (full-text article views including HTML views, PDF and ePub downloads, according to the available data) and Abstracts Views on Vision4Press platform.
Data correspond to usage on the plateform after 2015. The current usage metrics is available 48-96 hours after online publication and is updated daily on week days.
Initial download of the metrics may take a while.