Fig. 6
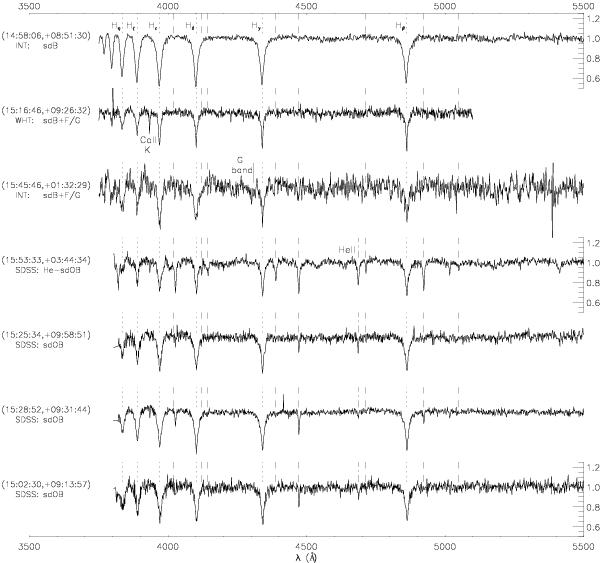
Follow-up spectroscopy gathered at the INT and WHT for some candidates of Table 4, and SDSS spectra that were available for some others from Tables 4 and 5 (last four panels). The first Balmer lines are indicated as dotted vertical lines; dashed vertical lines indicate the HeI spectral lines; HeII4686 is marked with a dashed-dotted line; the G-band is also indicated when present.
Current usage metrics show cumulative count of Article Views (full-text article views including HTML views, PDF and ePub downloads, according to the available data) and Abstracts Views on Vision4Press platform.
Data correspond to usage on the plateform after 2015. The current usage metrics is available 48-96 hours after online publication and is updated daily on week days.
Initial download of the metrics may take a while.