Fig. 9
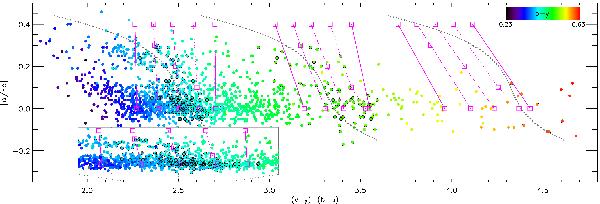
[α/Fe] versus (v − y) − (b − u) for our 1498 calibrating stars. Bluer (redder) colours indicate hotter (cooler) stars, according to their (b − y), as shown in the top right box. Squares are synthetic colours computed from MARCS model fluxes at fixed [α/Fe] (as available from MARCS library) for selected values of (b − y) = 0.4,0.5,0.6 (from left to right) and [Fe/H] = 0.00 dex with [α/Fe] = 0:0.4 dex (continuous line) [Fe/H] = −0.25 dex with [α/Fe] = 0:0.1:0.4 dex (dotted lines), [Fe/H] = −0.50 dex with [α/Fe] = 0:0.2:0.4 dex (dashed lines), [Fe/H] = −0.75 dex with [α/Fe] = 0:0.3:0.4 dex (dot-dashed lines), [Fe/H] = −1.00 dex with [α/Fe] = 0:0.4 dex (triple-dot-dashed lines). Stars within 0.01 mag of the selected (b − y) interval are shown with open circles to highlight the trend. Grey dotted lines are fiducials built for those stars. Lower left panel is a zoom of the (b − y) = 0.4 data set for 2.2 ≤ (v − y) − (b − u) ≤ 2.8.
Current usage metrics show cumulative count of Article Views (full-text article views including HTML views, PDF and ePub downloads, according to the available data) and Abstracts Views on Vision4Press platform.
Data correspond to usage on the plateform after 2015. The current usage metrics is available 48-96 hours after online publication and is updated daily on week days.
Initial download of the metrics may take a while.