Fig. 6
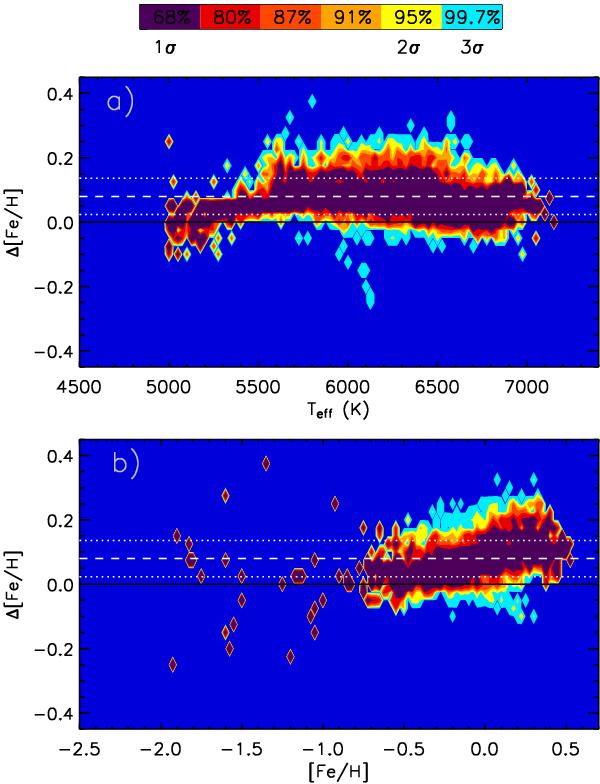
Δ [Fe/H] (in the sense ours minus GCSII) as function of Teff (panel a)) and [Fe/H] (panel b)) for stars in the irfm sample satisfying the applicability range of our metallicity calibration. Notice the two breaks at 5500 K and 6500 K which correspond to the discontinuities introduced by the three calibrations used in GCSII for different (b − y). Contour levels and lines as in Fig. 2.
Current usage metrics show cumulative count of Article Views (full-text article views including HTML views, PDF and ePub downloads, according to the available data) and Abstracts Views on Vision4Press platform.
Data correspond to usage on the plateform after 2015. The current usage metrics is available 48-96 hours after online publication and is updated daily on week days.
Initial download of the metrics may take a while.