Fig. 4
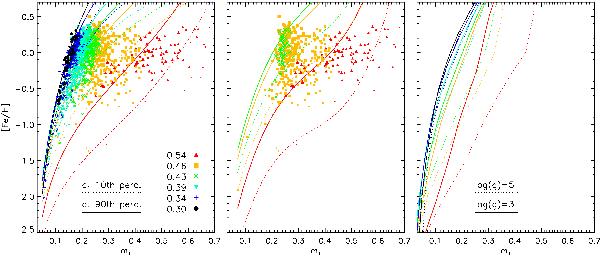
Left panel: [Fe/H] versus m1 for our 1498 calibrating stars in different (b − y) ranges represented by different symbols (median values as indicated in the labels). The size of the symbols increases with higher values of c1. Dotted and continuous lines represent Eq. (2) at these median values for the 10th and 90th percentiles of the c1 distribution. Central panel: same as left panel, but for Eq. (3), which applies only to cool stars. Right panel: theoretical [Fe/H] versus m1 relation when using synthetic colours from the “MARCS-standard” library and log g instead of c1 (see text for discussion).
Current usage metrics show cumulative count of Article Views (full-text article views including HTML views, PDF and ePub downloads, according to the available data) and Abstracts Views on Vision4Press platform.
Data correspond to usage on the plateform after 2015. The current usage metrics is available 48-96 hours after online publication and is updated daily on week days.
Initial download of the metrics may take a while.