Fig. 2
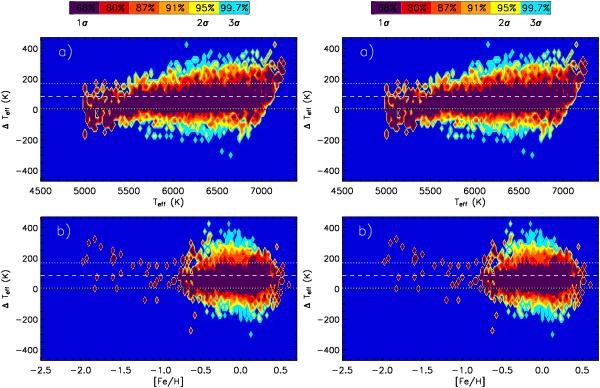
Panels a) and b) ΔTeff (ours minus GCSII) as a function of our Teff (upper) and [Fe/H] (lower) for stars in the irfm sample. Panels c) and d) same as before, but for all remaining GCS stars in the clbr sample (see discussion in Sect. 2.1). Contour levels are computed on abscissa intervals of 25 K and 0.025 dex, respectively, to equally represent regions with fewer stars. Dashed and dotted lines indicate the mean difference and standard deviation of the entire sample; because they are symmetric and are dominated by regions with the highest overdensity of stars, the dashed and dotted lines are in some cases offset from the local 1σ contour levels.

Current usage metrics show cumulative count of Article Views (full-text article views including HTML views, PDF and ePub downloads, according to the available data) and Abstracts Views on Vision4Press platform.
Data correspond to usage on the plateform after 2015. The current usage metrics is available 48-96 hours after online publication and is updated daily on week days.
Initial download of the metrics may take a while.