Fig. 2
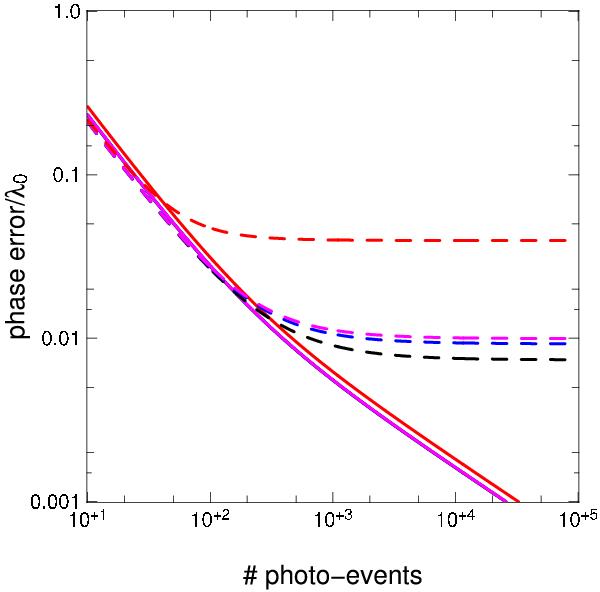
Relative errors σφ/λ of temporal (dash) and static (solid) ABCD phase estimators in the H-band as a function of the number of detected photo-events K. Black, blue, magenta, and red curves represent Excellent, Good, Medium and Bad conditions respectively as defined in Table 1. The plots are made for the ATs for an integration time of 2 ms for the specific ABCD implementation considered here. Note that for the static ABCD, the black, blue, and magenta curves are superimposed because of close performances.
Current usage metrics show cumulative count of Article Views (full-text article views including HTML views, PDF and ePub downloads, according to the available data) and Abstracts Views on Vision4Press platform.
Data correspond to usage on the plateform after 2015. The current usage metrics is available 48-96 hours after online publication and is updated daily on week days.
Initial download of the metrics may take a while.