Fig. 5
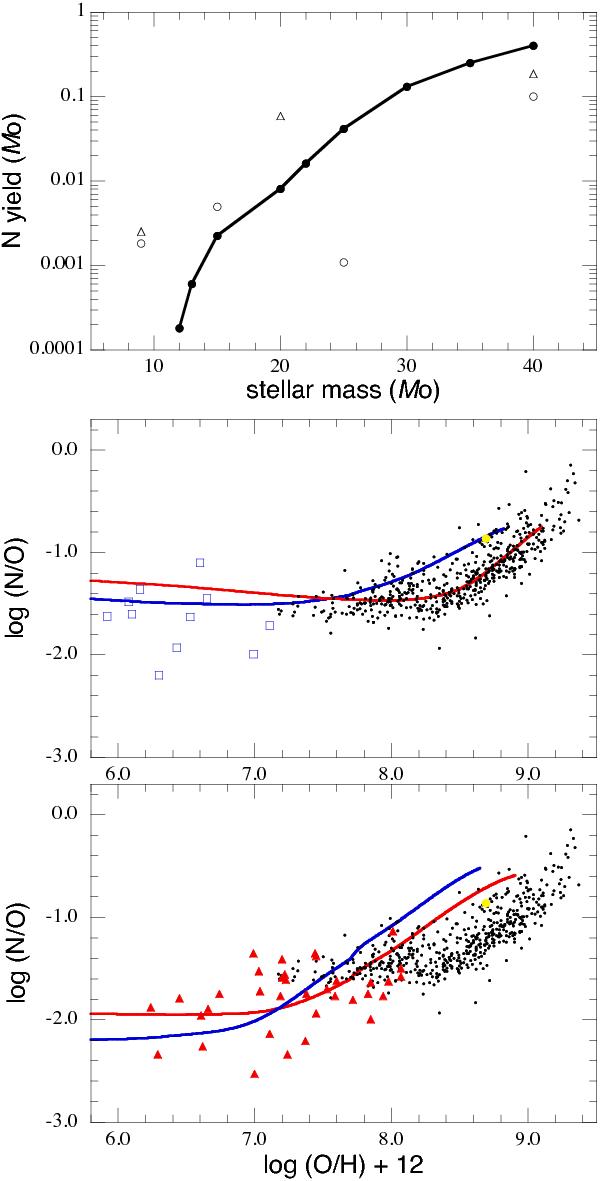
Upper panel: adopted N yield as a function of the progenitor mass. For reference, new nucleosynthesis results are attached (circles: Ekström et al. 2008; triangles: Hirschi 2007). Middle panel: N/O evolution predicted by the models with a Salpeter IMF (x = −1.35; blue curve) and a flatter one (x = −1.1; red curve). The symbols of the observed data are the same as in Fig. 1. Lower panel: N/O evolution calculated with the models in which the upper mass of the IMF ends at 25 M⊙ (red curve) and 20 M⊙ (blue curve).
Current usage metrics show cumulative count of Article Views (full-text article views including HTML views, PDF and ePub downloads, according to the available data) and Abstracts Views on Vision4Press platform.
Data correspond to usage on the plateform after 2015. The current usage metrics is available 48-96 hours after online publication and is updated daily on week days.
Initial download of the metrics may take a while.