Fig. 1
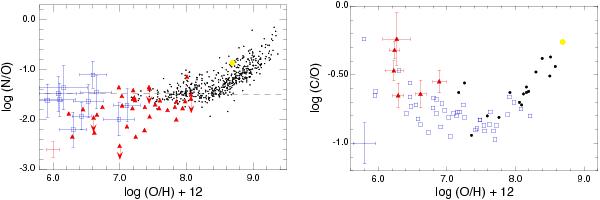
Left panel: correlation of N/O with O/H in DLA systems (triangles: Pettini et al. 2008), Galactic halo stars (squares: Spite et al. 2005), and extragalactic H II regions (small dots). The data of H II regions are from the sources assembled by Pettini et al. (2008). The error bar in the bottom corner is for DLAs. The dashed line is the approximate plateau level seen in extragalactic H II regions. The large yellow dot corresponds to the solar abundances (Asplund et al. 2009). Right panel: correlation of C/O with O/H. The data of H II regions are from Garnett et al. (1995, 1997, 1999) and Kobulnicky et al. (1997). The Galactic values are from Fabbian et al. (2009a). The error bar in the bottom left-hand corner gives an indication of the typical uncertainty for halo stars.
Current usage metrics show cumulative count of Article Views (full-text article views including HTML views, PDF and ePub downloads, according to the available data) and Abstracts Views on Vision4Press platform.
Data correspond to usage on the plateform after 2015. The current usage metrics is available 48-96 hours after online publication and is updated daily on week days.
Initial download of the metrics may take a while.