Fig. 9
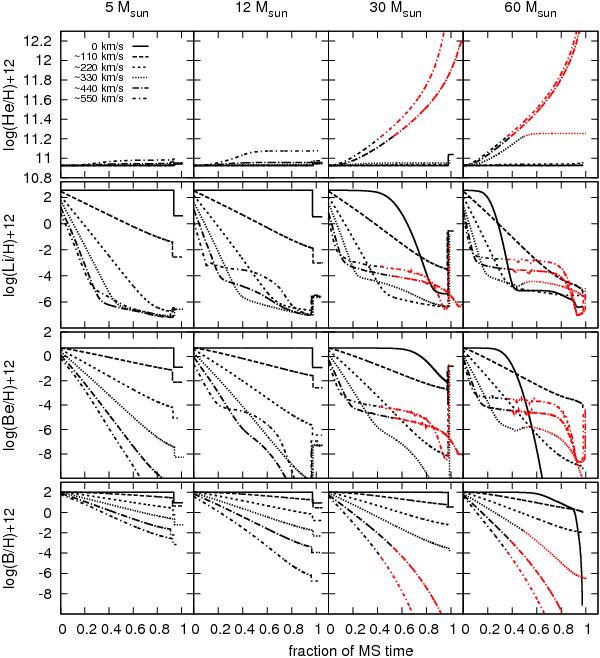
Change of the surface abundances of helium, lithium, beryllium and boron along evolutionary tracks of SMC composition as a function of time, expressed as a fraction of the main-sequence lifetime. Different line styles represent different initial rotational velocities (see legend). For models where the surface helium mass fraction exceeded 40%, the abundances are plotted in red, to indicate that the reference element hydrogen is depleted significantly (see also Sect. 4).
Current usage metrics show cumulative count of Article Views (full-text article views including HTML views, PDF and ePub downloads, according to the available data) and Abstracts Views on Vision4Press platform.
Data correspond to usage on the plateform after 2015. The current usage metrics is available 48-96 hours after online publication and is updated daily on week days.
Initial download of the metrics may take a while.