Fig. 3
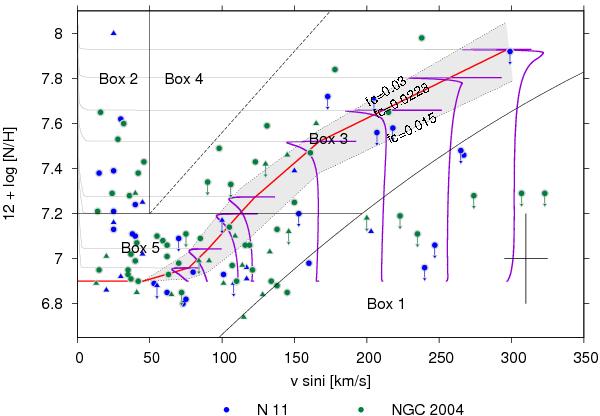
Nitrogen surface abundance versus projected rotational velocity for stars in the LMC sample of the FLAMES survey (Hunter et al. 2009) in the N11 (blue) and the NGC 2004 (green) fields. Stars with evidence for a binary companion from radial velocity variations are plotted as triangles. Black solid lines indicate regions that are helpful as a reference in later discussion (see also Paper II). Evolutionary tracks of 13 M⊙ models are plotted for various rotational velocities, shifted by a factor π/4 to account for random inclination angles. The red line marks the nitrogen abundance reached at the end of the main sequence for 13 M⊙ models adopting a mixing efficiency of fc = 0.0228 (our calibration). Thin dotted lines show the location of the line, if different values for fc are adopted, e.g. fc = 0.015 (lower line) and fc = 0.03 (upper line).
Current usage metrics show cumulative count of Article Views (full-text article views including HTML views, PDF and ePub downloads, according to the available data) and Abstracts Views on Vision4Press platform.
Data correspond to usage on the plateform after 2015. The current usage metrics is available 48-96 hours after online publication and is updated daily on week days.
Initial download of the metrics may take a while.