Fig. 1
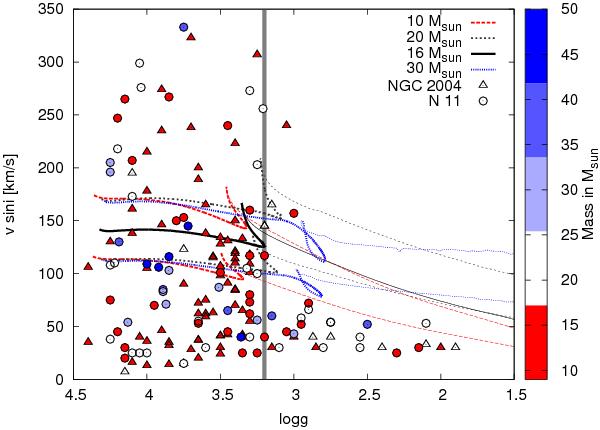
Projected rotational velocity versus surface gravity for stars in the FLAMES survey near LMC clusters NGC 2004 (triangles) and N11 (circles). Color coding indicates the stellar mass. We use the sudden transition at log g = 3.2 (vertical line) to calibrate the amount of overshooting of our 16 M⊙ model (black line), see Sect. 2.4. For comparison we plot several other models with different initial masses and rotation rates (dotted lines).
Current usage metrics show cumulative count of Article Views (full-text article views including HTML views, PDF and ePub downloads, according to the available data) and Abstracts Views on Vision4Press platform.
Data correspond to usage on the plateform after 2015. The current usage metrics is available 48-96 hours after online publication and is updated daily on week days.
Initial download of the metrics may take a while.