Fig. 3
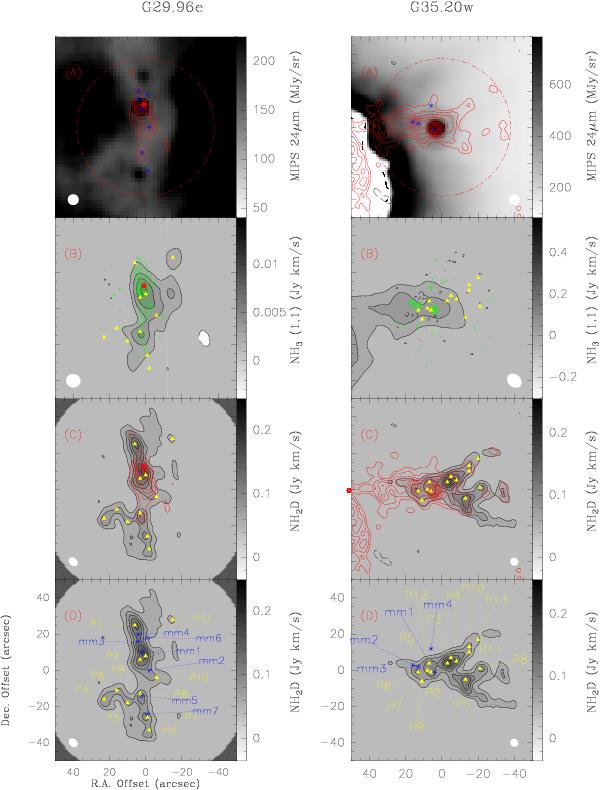
Line and Continuum emission towards G29.96e (left) and G35.20w (right). Panel A) Spitzer 8 μ (for G29.96e)/24μ (for G35.20w) emission and 3.5 mm PdBI dust continuum emission as contours. Panel B) VLA NH3 (1, 1) integrated intensity map and 1.3 mm PdBI dust continuum emission as contours. Panel C) PdBI NH2D integrated intensity map and 3.5 mm PdBI dust continuum emission as contours. Panel D) PdBI NH2D integrated intensity map with the clumps identified from CLUMPFIND from P1. The PdBI primary beam at 3.5 mm is shown as dashed circle in the top most panel. The contour levels for all the maps (line and continuum) start at −3σ, 3σ in steps of 3σ. The positions of the NH2D cores (P1..) given in Table 4 are marked as filled triangles, the 1.3 mm cores (mm1..) are marked as stars and the synthesized beam of the background image shown as filled white ellipses. For G29.96e, we have also marked the methanol maser positions identified by Walsh et al. (1998) as red stars.
Current usage metrics show cumulative count of Article Views (full-text article views including HTML views, PDF and ePub downloads, according to the available data) and Abstracts Views on Vision4Press platform.
Data correspond to usage on the plateform after 2015. The current usage metrics is available 48-96 hours after online publication and is updated daily on week days.
Initial download of the metrics may take a while.