Fig. 1
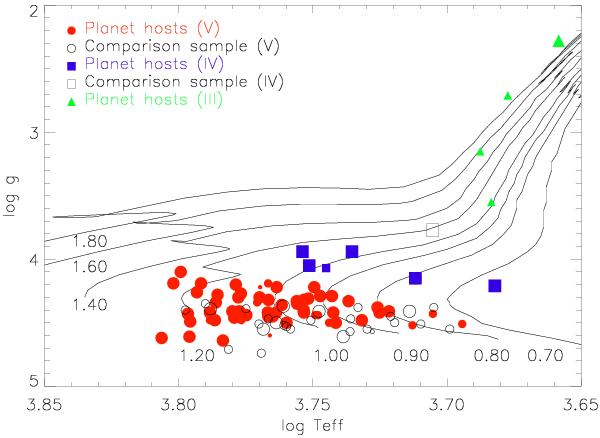
HR diagram: surface gravity vs effective temperatures of the stars in our sample including the stars in Tables 1–3. We overplot solar metallicity tracks from Girardi et al. (2000) for 0.7 to 1.8 M⊙. The luminosity classes of the stars in the sample are assigned according to each stars position in this diagram (see Sect. 3). Metallicity is represent by the size of the symbol.
Current usage metrics show cumulative count of Article Views (full-text article views including HTML views, PDF and ePub downloads, according to the available data) and Abstracts Views on Vision4Press platform.
Data correspond to usage on the plateform after 2015. The current usage metrics is available 48-96 hours after online publication and is updated daily on week days.
Initial download of the metrics may take a while.