Fig. 2
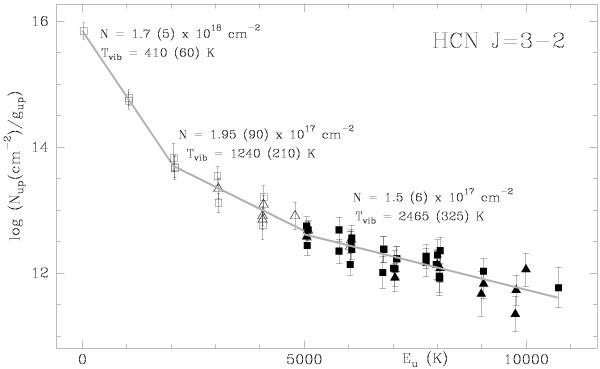
Vibrational temperature diagram derived from the HCN J = 3–2 lines given in Table 1. Upper level population vs. its energy above the ground state. The data is fitted by 3 line segments corresponding to regions with temperatures Tvib ~ 400 K, 1200 K, and 2400 K, respectively. HCN column densities are averaged over a source size of 1′′ diameter. A conservative calibration error of 30% has been applied to all intensities. Values in parentheses correspond to 3σ errors on the derived vibrational temperatures and column densities. Filled triangles correspond to lines with half-power widths Δv < 7 km s-1, filled squares correspond to lines with 7 < Δv < 9 km s-1, empty triangles correspond to lines with 9 < Δv < 12 km s-1, and empty squares to lines with Δv > 12 km s-1.
Current usage metrics show cumulative count of Article Views (full-text article views including HTML views, PDF and ePub downloads, according to the available data) and Abstracts Views on Vision4Press platform.
Data correspond to usage on the plateform after 2015. The current usage metrics is available 48-96 hours after online publication and is updated daily on week days.
Initial download of the metrics may take a while.