Fig. 7
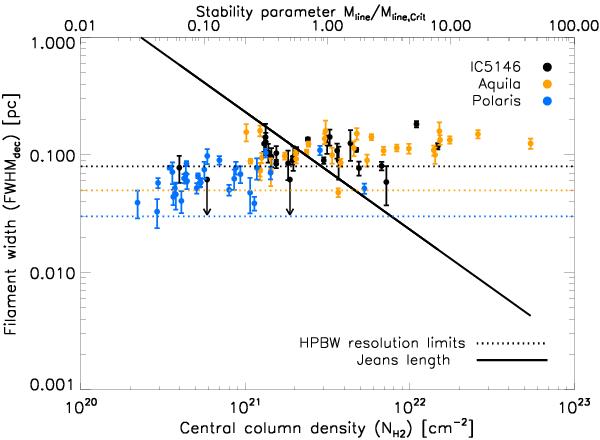
Mean deconvolved width (FWHM) versus mean central column density for the 27 filaments of IC 5146 shown in Fig. 3b, along with 32 filaments in Aquila and 31 filaments in Polaris, all analyzed in the same way (see Sect. 3). The spatial resolutions of the column density maps used in the analysis for the three regions are marked by the horizontal dotted lines. The filament width has a typical value of ~0.1 pc, regardless of central column density. The solid line running from top left to bottom right shows the central (thermal) Jeans length as a function of central column density [ ] for a gas temperature of 10 K.
Current usage metrics show cumulative count of Article Views (full-text article views including HTML views, PDF and ePub downloads, according to the available data) and Abstracts Views on Vision4Press platform.
Data correspond to usage on the plateform after 2015. The current usage metrics is available 48-96 hours after online publication and is updated daily on week days.
Initial download of the metrics may take a while.