Fig. 4
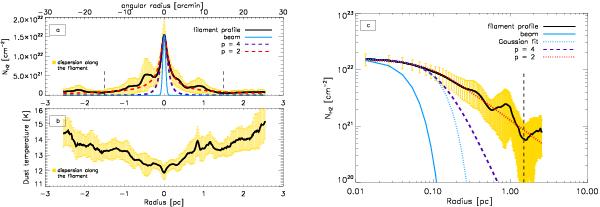
a) Mean radial column density profile perpendicular to the supercritical filament labeled 6 in Fig. 3b (black curve). The area in yellow shows the dispersion of the radial profile along the filament. The inner curve in light blue corresponds to the effective 36.9″ HPBW resolution (0.08 pc at 460 pc) of the column density map of Fig. 3a used to construct the profile. The dashed red curve shows the best-fit model of the form expressed by Eq. (1), with p = 2. For comparison, the dashed blue curve shows a model with p = 4, corresponding to a hydrostatic isothermal equilibrium filament (Ostriker 1964). The two dashed vertical segments at ~ ±1.5 pc mark the bounds within which the profile was integrated to estimate the mass per unit length Mline. b) Mean radial dust temperature profile measured perpendicular to filament 6. c) Same as a) displayed in log-log format to better visualize the flatter inner part of the profile and the power-law behavior at large radii.
Current usage metrics show cumulative count of Article Views (full-text article views including HTML views, PDF and ePub downloads, according to the available data) and Abstracts Views on Vision4Press platform.
Data correspond to usage on the plateform after 2015. The current usage metrics is available 48-96 hours after online publication and is updated daily on week days.
Initial download of the metrics may take a while.