Fig. 3
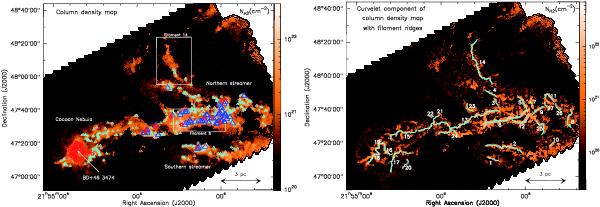
a) Column density map derived from our SPIRE/PACS observations of IC 5146. The resolution corresponds to the 36.9″ HPBW resolution of SPIRE at 500 μm. The YSOs and starless cores detected with Herschel (using getsources, a source-finding algorithm described in Men’shchikov et al. 2010) are overplotted as red stars and blue triangles respectively; bound starless cores are larger triangles in dark blue (cf. Fig. 2b and Könyves et al. 2010, for classification details). The locations of the two filaments (6 and 14) whose radial profiles are shown in Fig. 4 and Fig. 5 are marked by the white rectangles. b) Curvelet component of the column density map, with the network of 27 identified filaments shown in blue.
Current usage metrics show cumulative count of Article Views (full-text article views including HTML views, PDF and ePub downloads, according to the available data) and Abstracts Views on Vision4Press platform.
Data correspond to usage on the plateform after 2015. The current usage metrics is available 48-96 hours after online publication and is updated daily on week days.
Initial download of the metrics may take a while.