Free Access
Fig. 4
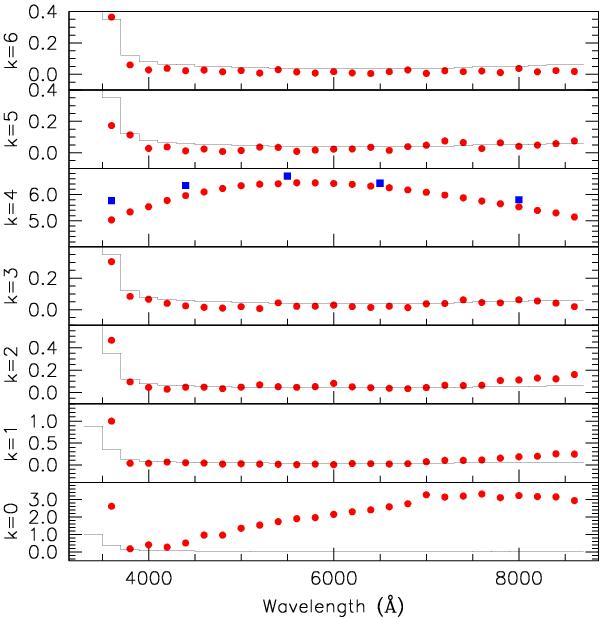
Power spectrum of the first six harmonics as a function of wavelength (ordinate scale is in %). The solid thin lines trace the 5-σ confidence level. The filled squares in the k = 4 plot are the broad-band polarization measurements by Schmidt et al. (1992).
Current usage metrics show cumulative count of Article Views (full-text article views including HTML views, PDF and ePub downloads, according to the available data) and Abstracts Views on Vision4Press platform.
Data correspond to usage on the plateform after 2015. The current usage metrics is available 48-96 hours after online publication and is updated daily on week days.
Initial download of the metrics may take a while.