Fig. 3
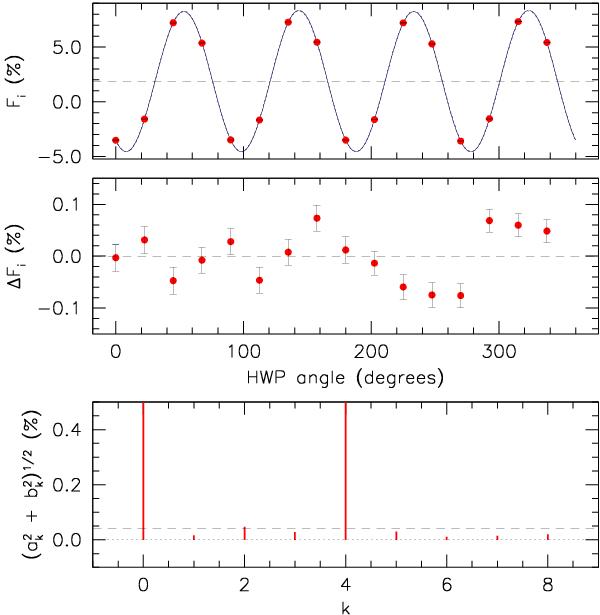
Fourier analysis applied to the polarized standard star BD+59d389 at 5500 Å (200 Å bin). Top: normalized flux differences. The curves trace the partial reconstruction using eight harmonics (solid) and the fourth harmonic only (dotted). The dashed horizontal line is placed at the average of the F values (a0). Middle: residuals from the reconstruction using the k = 4 harmonic. Bottom: harmonics power spectrum. The dashed line indicates the 5-σ level uncertainty.
Current usage metrics show cumulative count of Article Views (full-text article views including HTML views, PDF and ePub downloads, according to the available data) and Abstracts Views on Vision4Press platform.
Data correspond to usage on the plateform after 2015. The current usage metrics is available 48-96 hours after online publication and is updated daily on week days.
Initial download of the metrics may take a while.