Fig. 1
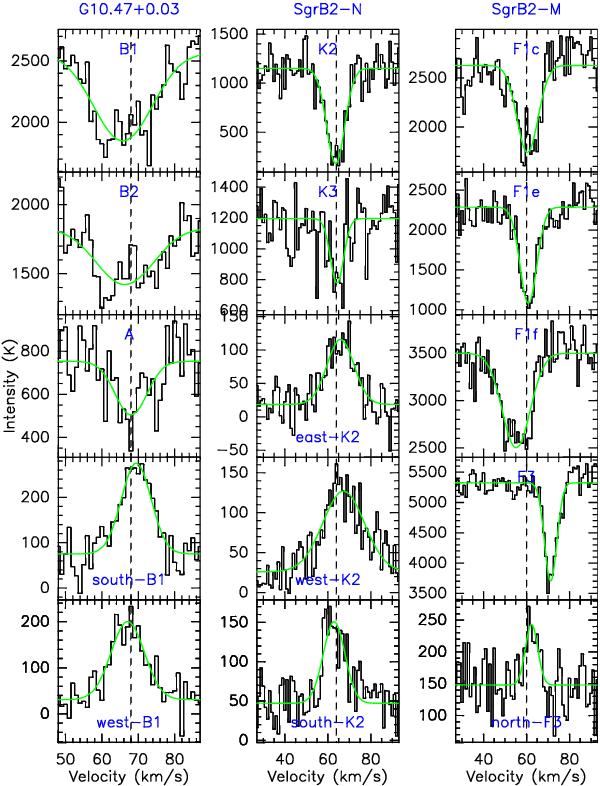
The v2 = 1, J = 13 direct ℓ-type line of HCN observed toward several positions in G10.47+0.03 (left column), SgrB2-N (central column), and SgrB2-M (right column). The emission lines are averaged over the areas shown in Figs. 2, 4, and 6, while the absorption lines are observed with the beams given in Table 1. Overlaid in green are Gaussian fits, whose parameters are given in Tables 2 and 3. The vertical dashed lines mark the assumed systemic velocities.
Current usage metrics show cumulative count of Article Views (full-text article views including HTML views, PDF and ePub downloads, according to the available data) and Abstracts Views on Vision4Press platform.
Data correspond to usage on the plateform after 2015. The current usage metrics is available 48-96 hours after online publication and is updated daily on week days.
Initial download of the metrics may take a while.