Fig. 3
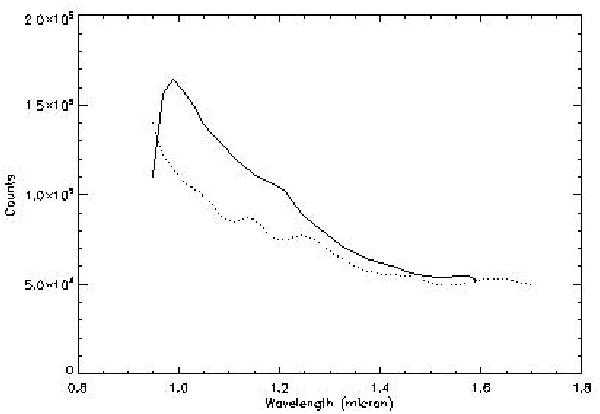
Example of the simulated spectra on a spaxel rescaled according to the wavelength for SPHERE IFS simulations. The dotted line represents the value of one single pixel on the PSFs used as input for the CSP code. The solid line represents the same thing on the images of the datacube resulting from the CSP simulation (passage of the light through the instrument and correct calibration to create the datacube). The absolute values of these two curve have been normalized to be able to overplot one on the other.
Current usage metrics show cumulative count of Article Views (full-text article views including HTML views, PDF and ePub downloads, according to the available data) and Abstracts Views on Vision4Press platform.
Data correspond to usage on the plateform after 2015. The current usage metrics is available 48-96 hours after online publication and is updated daily on week days.
Initial download of the metrics may take a while.