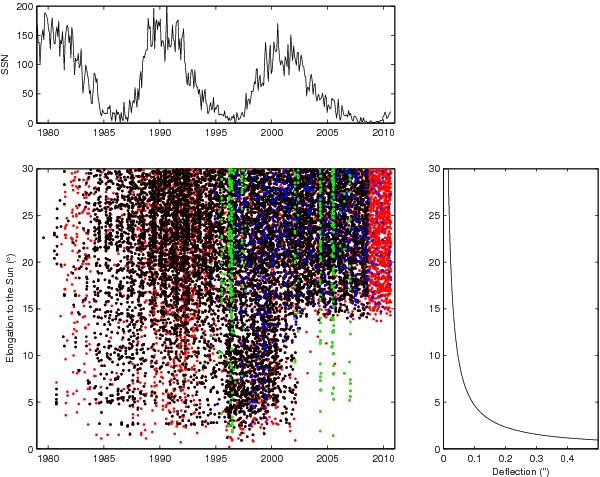
Fig. 1

The main plot displays the observational history of the sources at less than 30° from the Sun (black: observations treated in LL09; red: additional observations of routine experiments not processed in LL09 excluding VLBA+ and VLBA; blue: VLBA+; green: VLBA). The upper plot gives the Sun spot number (SSN, Clette et al. 2007). The right plot displays the deflection angle predicted by General Relativity.
Current usage metrics show cumulative count of Article Views (full-text article views including HTML views, PDF and ePub downloads, according to the available data) and Abstracts Views on Vision4Press platform.
Data correspond to usage on the plateform after 2015. The current usage metrics is available 48-96 hours after online publication and is updated daily on week days.
Initial download of the metrics may take a while.


