Fig. 13
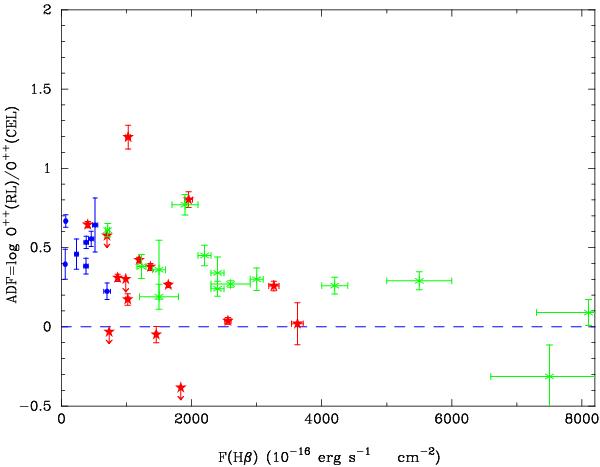
Comparison of the abundance discrepancy factor ADF = log O++(RL)/O++(CEL) with observed F(Hβ). Data from UVES and FORS medium resolution observations are shown by red stars and filled blue circles. Green asterisks are the data from Esteban et al. (2009). (A color version of this figure is available in the online journal.)
Current usage metrics show cumulative count of Article Views (full-text article views including HTML views, PDF and ePub downloads, according to the available data) and Abstracts Views on Vision4Press platform.
Data correspond to usage on the plateform after 2015. The current usage metrics is available 48-96 hours after online publication and is updated daily on week days.
Initial download of the metrics may take a while.