Fig. 12
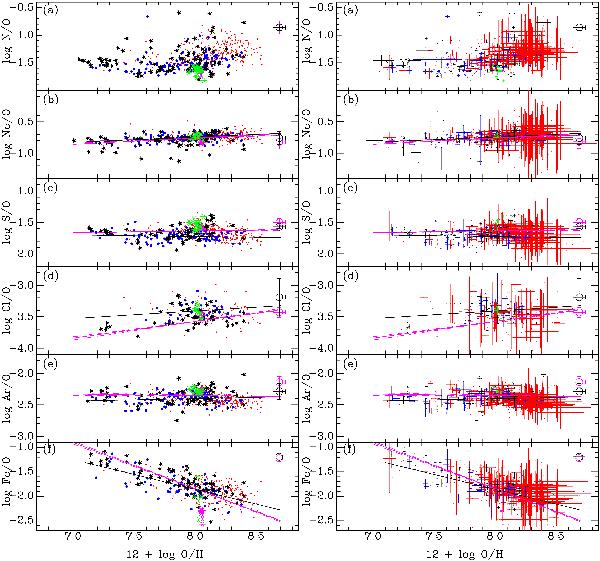
log N/O a), log Ne/O b), log S/O c), log Cl/O d), log Ar/O e) and log Fe/O f) vs. oxygen abundance 12 + log O/H for our sample of 121 spectra (large stars). Several knots in H ii regions NGC 346 and NGC 456 in the SMC are shown by green and purple large asterisks, respectively. Additionally we show the galaxies from the HeBCD sample of Izotov et al. (2004) and Izotov & Thuan (2004) for the primordial He abundance determination (small filled blue circles) and the sample of ~300 emission-line galaxies from the SDSS DR3 (Izotov et al. 2006) (red dots). The solar abundance ratios by Lodders (2003) and by Asplund et al. (2009) are indicated by the purple and black large open circles and the associated error bars. The straight black lines are linear regressions for the HeBCD sample by Izotov et al. (2006) and the purple ones are for all (except the SDSS data). The right panel shows the error bars. (A color version of this figure is available in the online journal.)
Current usage metrics show cumulative count of Article Views (full-text article views including HTML views, PDF and ePub downloads, according to the available data) and Abstracts Views on Vision4Press platform.
Data correspond to usage on the plateform after 2015. The current usage metrics is available 48-96 hours after online publication and is updated daily on week days.
Initial download of the metrics may take a while.