Fig. 9
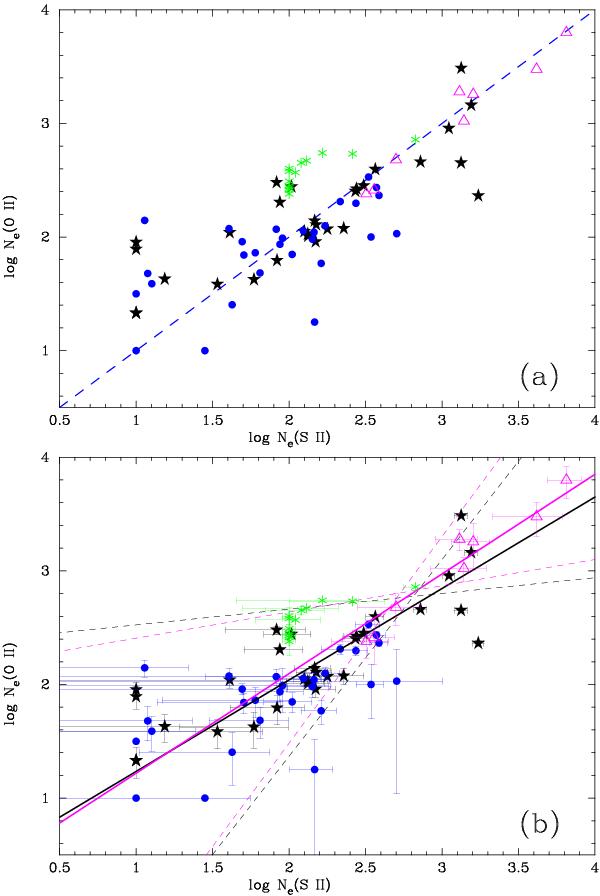
Ne(O ii) versus Ne(S ii). Black stars: VLT-UVES; filled blue circles: FORS observations (medium resolution). Purple triangles: data from García-Rojas & Esteban (2007), green asterisks: data from Esteban et al. (2009). The dashed blue line connects points of equal densities. The lower panel shows the error bars and regression lines and their 1σ alternatives for all data (purple lines) and for the VLT-only data (black lines). (A color version of this figure is available in the online journal.)
Current usage metrics show cumulative count of Article Views (full-text article views including HTML views, PDF and ePub downloads, according to the available data) and Abstracts Views on Vision4Press platform.
Data correspond to usage on the plateform after 2015. The current usage metrics is available 48-96 hours after online publication and is updated daily on week days.
Initial download of the metrics may take a while.