Fig. 8
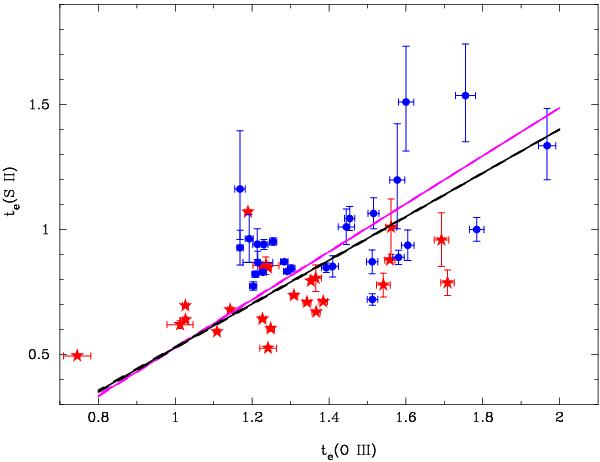
Comparison of electron temperatures te(O iii) (te = 10-4 Te) obtained from [O iii]λ4363/(λ4959 + λ5007) and te(S ii) obtained from [S ii]λ4068/(λ6717 + λ6730) emission-line ratios. Symbols are the same as in Fig. 7. Regression lines for all data are represented by purple lines. Regression lines for the UVES-only data are shown by black lines. (A color version of this figure is available in the online journal.)
Current usage metrics show cumulative count of Article Views (full-text article views including HTML views, PDF and ePub downloads, according to the available data) and Abstracts Views on Vision4Press platform.
Data correspond to usage on the plateform after 2015. The current usage metrics is available 48-96 hours after online publication and is updated daily on week days.
Initial download of the metrics may take a while.