Fig. 6
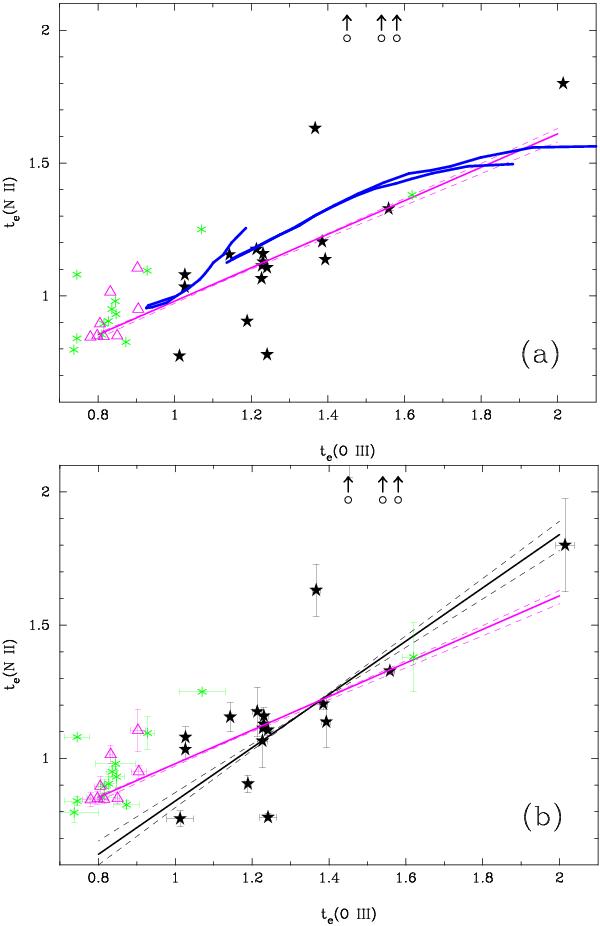
Comparison of electron temperatures te(O iii) (te = 10-4 Te) obtained from [O iii]λ4363/(λ4959 + λ5007) and te(N ii) obtained from [N ii]λ5755/λ6583 emission-line ratios. VLT/UVES and FORS data are shown by stars, except for two objects, which are shown as open circles (see text). Green asterisks and open purple triangles provide the data from Esteban et al. (2009) and García-Rojas & Esteban (2007), respectively. The thick blue lines show the predicted te(O ii) – te(O iii) relation for H ii region models from Izotov et al. (2006). Regression lines (solid lines) and 1σ alternatives (dashed lines) for all data are shown by purple lines. The lower panel shows the error bars. Additionally, regression lines for our VLT-only data are shown by black lines. (A color version of this figure is available in the online journal.)
Current usage metrics show cumulative count of Article Views (full-text article views including HTML views, PDF and ePub downloads, according to the available data) and Abstracts Views on Vision4Press platform.
Data correspond to usage on the plateform after 2015. The current usage metrics is available 48-96 hours after online publication and is updated daily on week days.
Initial download of the metrics may take a while.